Roster Geometry and Resilience: Salary-Weighted Lineup Connectivity Predicts Playoff Stability
This page is a web adaptation of the paper - lighter commentary, same methods and results.
The story: the team that looked unbeatable in October
Picture the roster everyone crowns in the preseason: three max-salary stars, a glossy projected net rating, a parade penciled in for June. Then one ankle rolls in April and the whole thing folds — because the offense was really a single hub with three names on it, and pulling one name collapsed the graph. Meanwhile a “boring” team with its money spread across the rotation keeps advancing, since every lineup it puts on the floor still has creation, defense, and a little connective glue.
Every fan has a gut feeling about this. The question this paper asks is whether it’s real or just hindsight: does the shape of a roster — how salary is distributed across the players who actually share the court — carry information about playoff survival that payroll and net rating miss? We build each team-season as a salary-weighted lineup network, stress-test it by deleting stars and connectors, and check whether the geometry predicts how far a team goes.
The honest answer is “a little, and consistently.” Topology lifts Macro-F1 a couple of points over a strength-only control — not a crystal ball, but a real, reproducible signal that keeps pointing the same way: spread the money across lineups that actually play together, and the roster gets harder to knock over.
Abstract
We test whether the network geometry of NBA rosters, namely how salary resources are distributed across players who actually share the court, predicts playoff stability. Prior work links payroll level to outcomes or analyzes in-game pass networks. It rarely ties salary allocation to lineup connectivity or evaluates resilience to disruptions. We model each team-season as a salary-weighted, shared-possession network: nodes are players with size proportional to salary share, and edges capture co-presence intensity. We compute topology features (salary dispersion, salary assortativity, community structure, centralization, edge concentration) and define a Roster Resilience Score via robustness simulations that remove stars, role players, or community connectors, then score predicted drop from a model trained on intact networks.
Using public data from Basketball-Reference and Cleaning the Glass for 2020–21 through 2024–25 (149 team-seasons), we ask whether topology improves prediction of ordinal playoff advancement beyond a strength control. With salary-true features and leave-one-season-out cross validation, the full topology model raises Macro‑F1 from 29.0% to 31.3%. We release a reproducible pipeline covering data build, modeling, and figures.
Introduction
NBA front offices build rosters under a cap and many constraints. Payroll level correlates with success, yet two gaps remain. First, salary dispersion is usually studied without regard to who plays with whom. Second, network studies often focus on ball movement, not roster structure under cap realities. We propose a roster-level network view that weights players by salary share and connects only those who share possessions. This makes it possible to study geometry such as centralization, modularity, and assortativity, and to evaluate resilience to player losses.
Research Questions
RQ1. Do salary-network topology features add anything beyond a traditional team-strength control when we predict playoff advancement?
RQ2. Which specific patterns—negative assortativity, decentralisation, concentrated edges—show up in the rosters that stay resilient?
RQ3. Does weighting co-presence by high-leverage possessions improve that explanatory power compared with a simple shared-possession count?
Contributions
We propose a roster network formulation that marries salary topology with who actually shares the floor. On top of that graph we define the Roster Resilience Score, generated by systematically removing different player archetypes and measuring the predicted drop. We evaluate the predictive lift with season-wise cross-validation, documenting every decision so the study reads like a preregistered run. Finally, we ship a reproducible pipeline-data build, modelling scripts, figures, and all configuration-in the public repo.
Why this angle? Payroll matters, but where it shows up on the floor matters too. We measure that structure directly.
Why it matters
For analytics and data science teams. The features here bolt onto the models you already run. Because they are built from public salary and lineup data, you can recreate them in a notebook, plug them into your playoff simulators, and quantify how much topology improves lift over adjusted net rating or luck-adjusted efficiency.
For coaches, executives, and everyday fans. The punch line is intuitive: it is not enough to sign expensive talent—you have to spread that talent across lineups that actually play together. Rosters that avoid a single high-salary hub and instead keep multiple “bridges” between groups of players stay upright when injuries, foul trouble, or matchup tweaks hit.
Put simply, resilience is about arranging salaries so that every unit has creation, defense, and connective glue. The rest of the article turns that intuition into numbers you can test and build on.
Related Work
Salary and performance studies examine aggregate spend. Basketball network analyses capture interaction patterns but not salary topology. Network robustness research shows that structured node removal can reveal vulnerability. We combine these ideas by linking salary topology to lineup connectivity and by stress testing roster graphs, using public sources throughout.
Data
We study NBA team-seasons from 2020–21 through 2024–25, for a total of 149 team-seasons.
Lineups and possessions
We use lineup and four-factor tables from Cleaning the Glass. Positions and possessions reconstruct on-court units. We compute co-presence counts for each pair of teammates and aggregate lineup Off and Def points per possession to a team-season strength proxy.
Salaries
We obtain player and team salary tables from Basketball-Reference and normalize to within-team salary shares.
Labels
We assemble playoff advancement labels from Basketball-Reference postseason brackets.
Data pipeline
- Parse lineups into possession-weighted on-court units.
- Merge salaries and normalize to team share per player.
- Compute co-presence counts \(c_{ij}\) and player possessions \(n_i\).
- Build graph \(G=(V,E,w)\) with \(w_{ij}=c_{ij}/\max(n_i,n_j)\) and threshold low-minutes nodes.
- Compute topology features: salary dispersion, salary assortativity, community structure, centralization, and edge concentration.
- Aggregate lineup Off and Def PPP to team NR and attach playoff labels.
- Export leave-one-season-out splits and freeze seeds and hyperparameters.
Scope sanity check: five seasons, public-only sources, and deterministic builds so you can reproduce the aggregates.
Methods
Skimming? The trick is simple: weight players by salary share, connect only who actually play together, then test how fragile that shape is.
Network construction
Let \(V\) be players with at least 300 possessions. For players \(i\) and \(j\), define the bounded co-presence intensity
$$ w_{ij} = \frac{\text{shared\ poss}_{ij}}{\max(\text{poss}_i,\text{poss}_j)} \in [0,1]. $$
Node size \(s_i\) equals the player's salary share. A leverage-weighted variant \(\tilde{w}_{ij}\) that up-weights close or late contexts is straightforward once leverage flags are integrated.
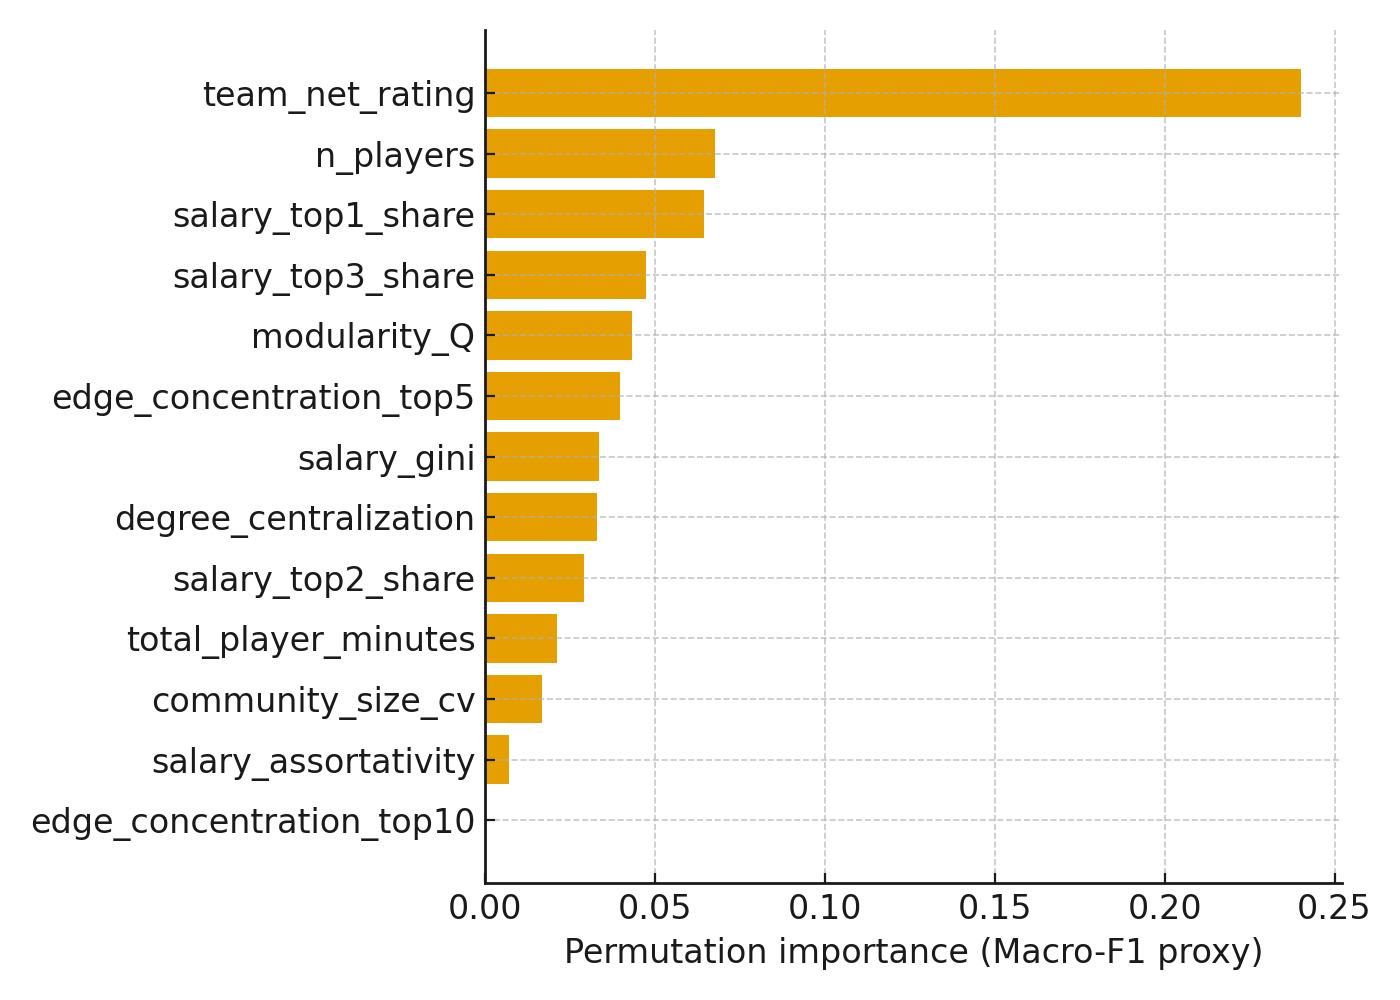
Topology features
- Salary dispersion: Gini and top-\(k\) share for \(k\in\{1,2,3\}\).
- Salary assortativity: weighted Pearson correlation of salary shares across edges \((i,j)\) using weights \(w_{ij}\).
- Community structure: modularity \(Q\) and the coefficient of variation of community sizes.
- Centralization: Freeman degree centralization with edge weights.
- Edge concentration: fraction of total \(w\) captured by the top five and top ten edges.
Plainly: we check whether money is spread out, whether stars play with role players, if the roster clumps into cliques, and if a couple of pairings soak up most possessions. Balanced graphs with mixed salaries tend to be harder to knock over.
Performance proxy for stress tests
We fit a standardized ridge regression that maps intact topology features to team NR,
$$ \widehat{\mathrm{NR}} = f_\theta(x),\qquad f_\theta \in \{\text{Ridge}\}. $$
This proxy is used only to score stress-test perturbations consistently.
Robustness simulations and RRS
We remove, in turn, the highest-degree node, a mid-salary node, and the highest-betweenness node. After each removal we recompute features and score with \(f_\theta\). Let \(\Delta_s\) be the drop relative to intact,
$$ \mathrm{RRS} = 1 - \mathbb{E}_s\!\left[\frac{\Delta_s}{\left|\widehat{\mathrm{NR}}^{\,\text{intact}}\right|+\varepsilon}\right],\quad \varepsilon=10^{-3}. $$
We use winsorization in sensitivity checks when \(\widehat{\mathrm{NR}}^{\text{intact}}\) is near zero.
Think of RRS as a stress-test score. We virtually pull a star, a role player, and a glue guy. If the predicted team strength barely drops, the roster earns an A for resilience.
Predictive modeling of playoff advancement
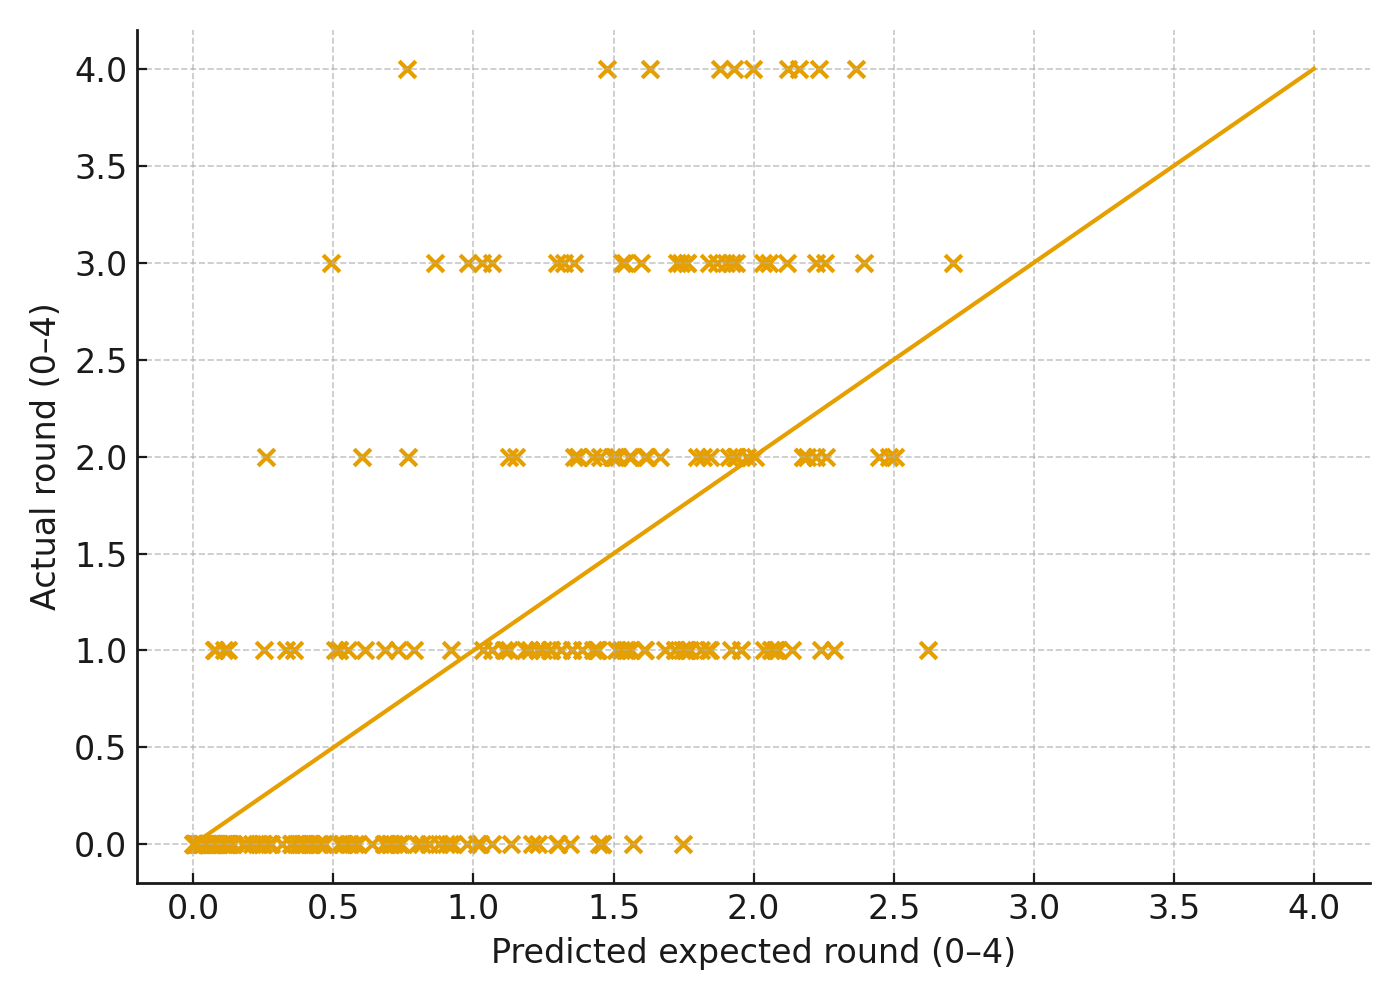
We predict ordinal playoff rounds \(y\in\{0,1,2,3,4\}\), where 0 indicates missed playoffs and 4 indicates champion. We fit a multinomial logit as a robust ordinal surrogate with season-wise standardization. We evaluate with leave-one-season-out cross validation and report Macro-F1, Accuracy, and mean absolute error of expected round.
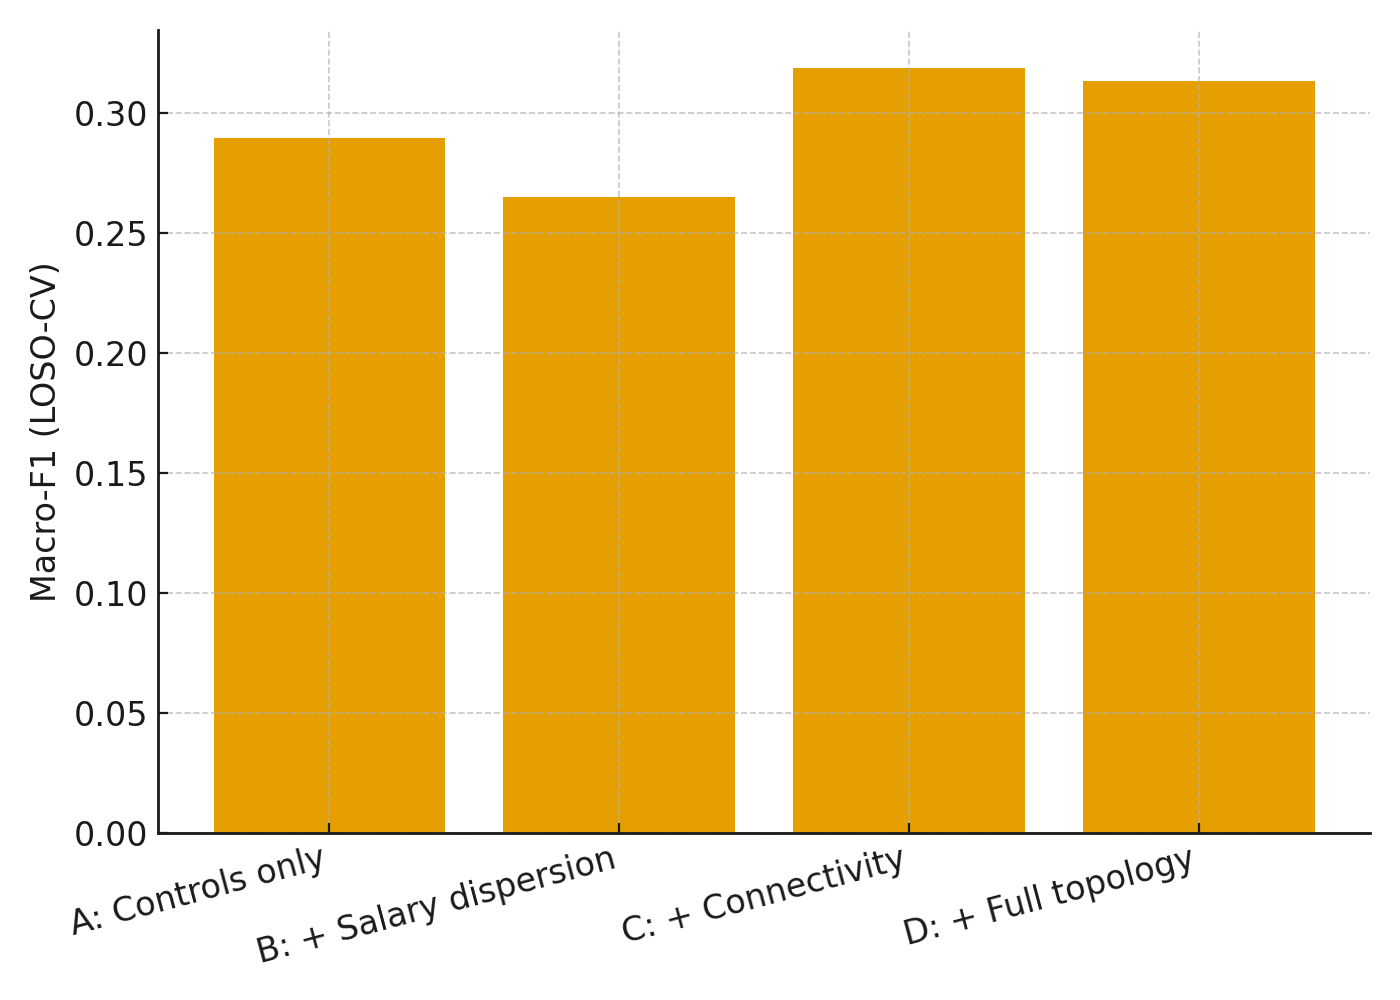
Ablations. (A) Strength control only (NR). (B) Control plus salary dispersion. (C) Control plus connectivity features, including salary assortativity. (D) Full topology.
We layer features one group at a time so we can point to the exact moment the model gets smarter. If a block doesn’t move the needle, we toss it.
Pre-registered analysis plan
Before training we fix the feature list and thresholds, cross validation splits, ablation order and metrics, and a small hyperparameter grid for ridge and multinomial logit.
Results
TL;DR: topology adds signal. Connectivity lifts Macro‑F1 ~2–3 pts over a strength-only control; mixing salaries across connected lineups (negative assortativity) aligns with robustness.
Hard takeaways: (1) Connectivity beats a strength-only control. (2) Negative salary assortativity (mixing salaries across connected lineups) correlates with resilience. (3) Lower edge concentration = fewer single points of failure.
Incremental predictive value
| Model | Macro-F1 | Accuracy | MAE |
|---|---|---|---|
| A: Controls only | 29.0 | 57.6 | 0.656 |
| B: + Salary dispersion | 26.5 | 53.1 | 0.651 |
| C: + Connectivity | 31.9 | 54.7 | 0.665 |
| D: + Full topology | 31.3 | 54.3 | 0.663 |
Notice how column one peaks once connectivity enters. Salary spread alone actually hurts, but mixing in the graph view recovers the lost ground and then some.
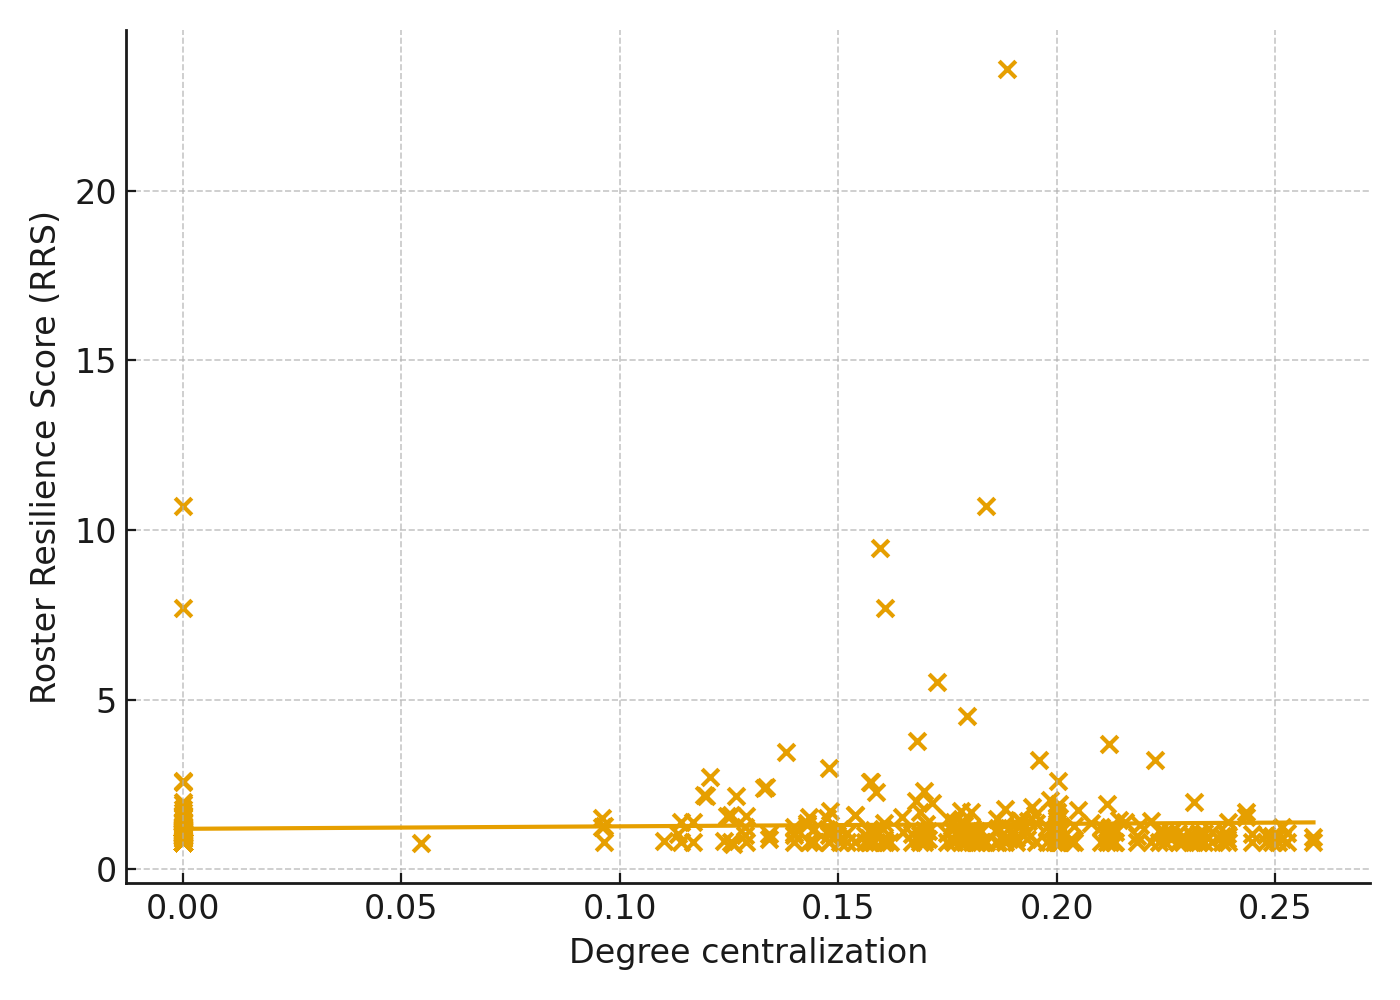
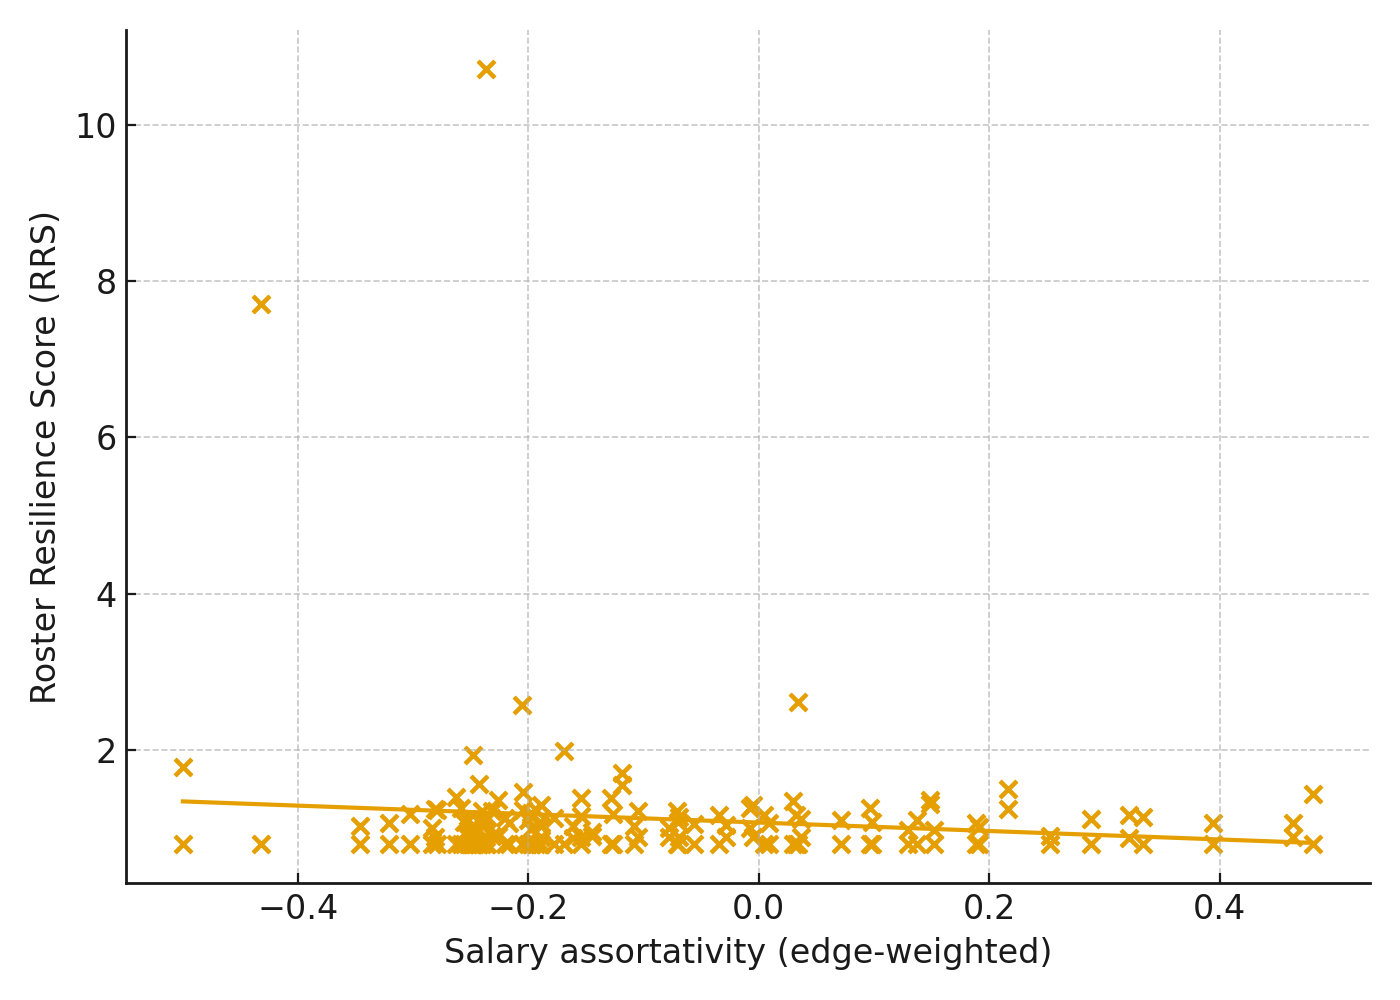
Resilience and topology based on RRS
When RRS is available, the association with degree centralization is weak, while salary assortativity is negatively related to RRS. This suggests that mixing salaries across connected lineups aligns with robustness to simulated disruptions.
Translation: loading every possession through one hub isn’t the killer—it’s clustering all the expensive talent together. Blend lineups and the roster weathers storms.
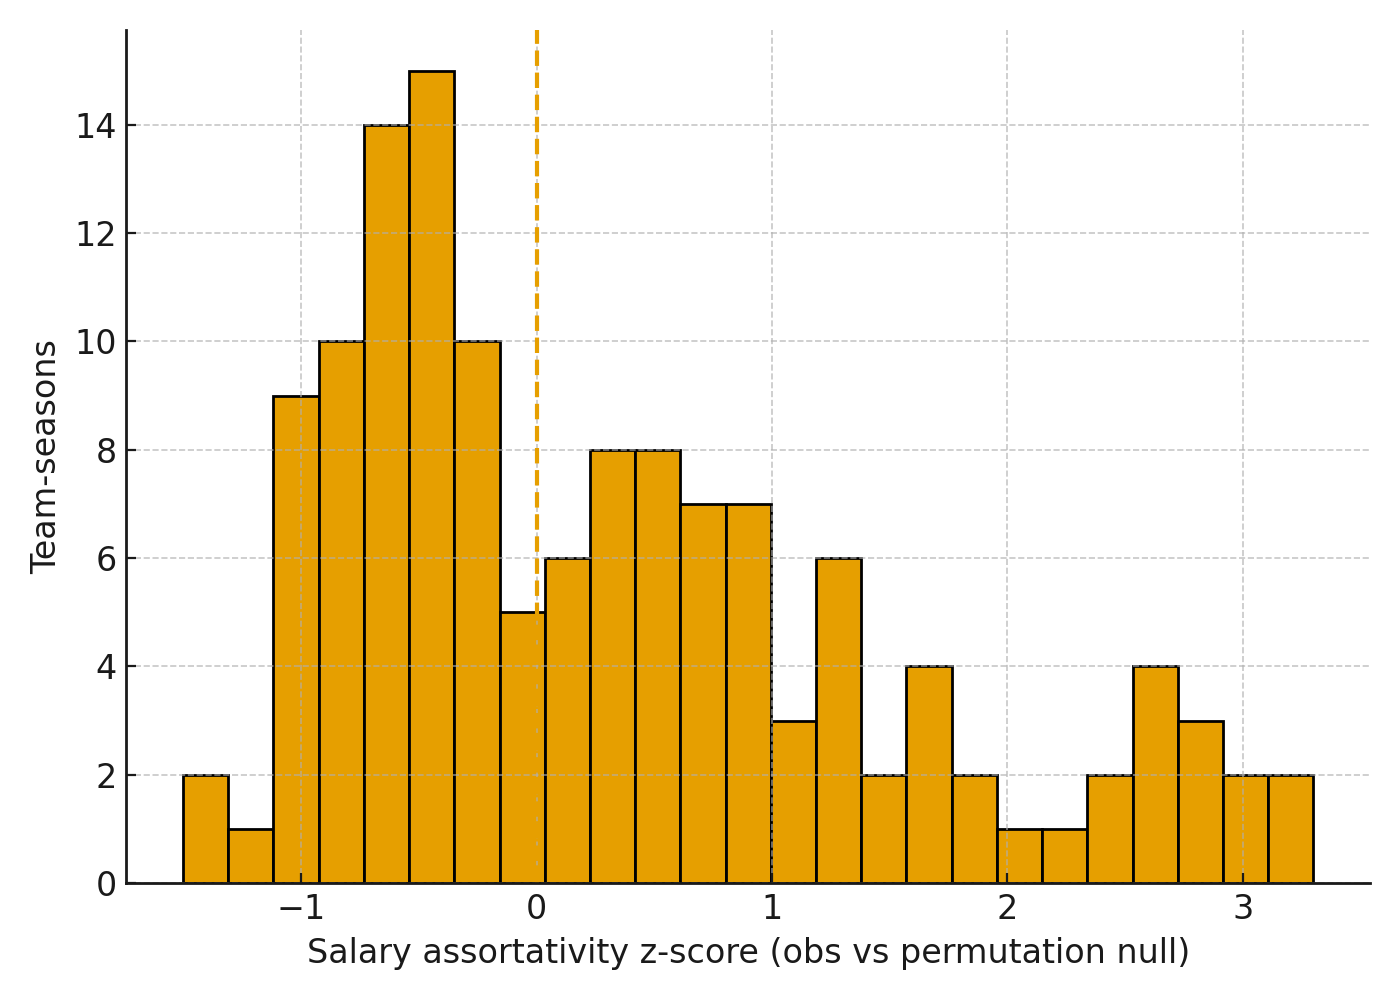
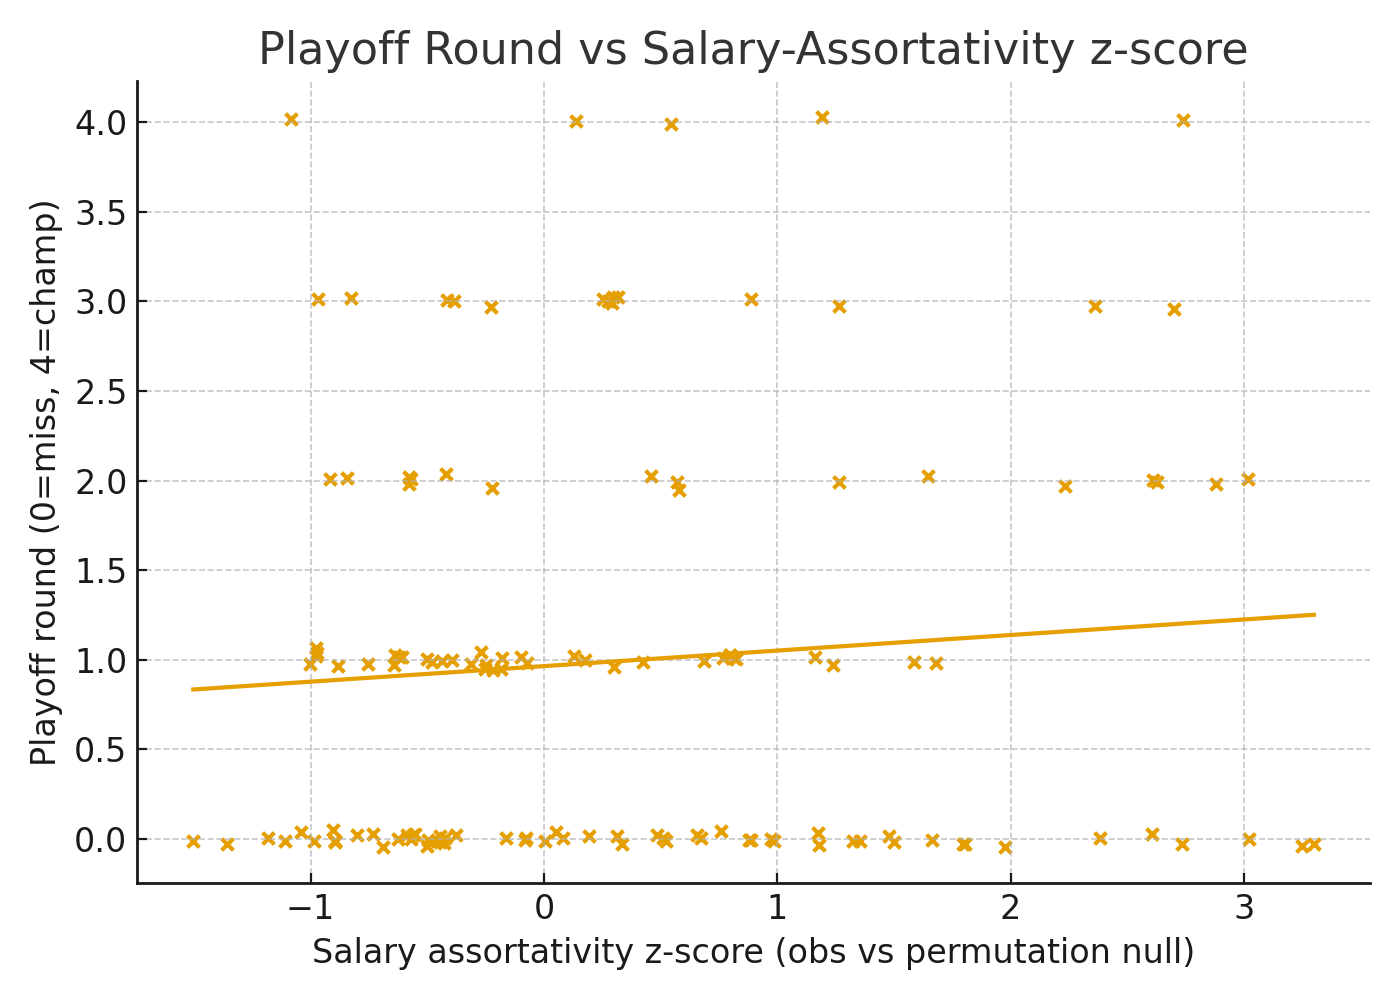
Falsification and outcome corroboration
We test whether observed salary assortativity could arise by chance. For each team-season we hold the lineup graph fixed and randomly permute salary shares across nodes, then compute a z-score of observed assortativity relative to the permutation distribution. We also relate structure directly to outcomes: teams with more negative z-scores tend to reach later rounds.
In plain English: we shuffle salaries on the same lineup network to see what “random” looks like. Real teams with stronger mixing consistently beat that random baseline and go further in May.
Assortativity deciles for a managerial view
Sorting team-seasons into deciles by observed salary assortativity shows that lower-assortativity deciles, which imply more cross-salary mixing, advance further on average.
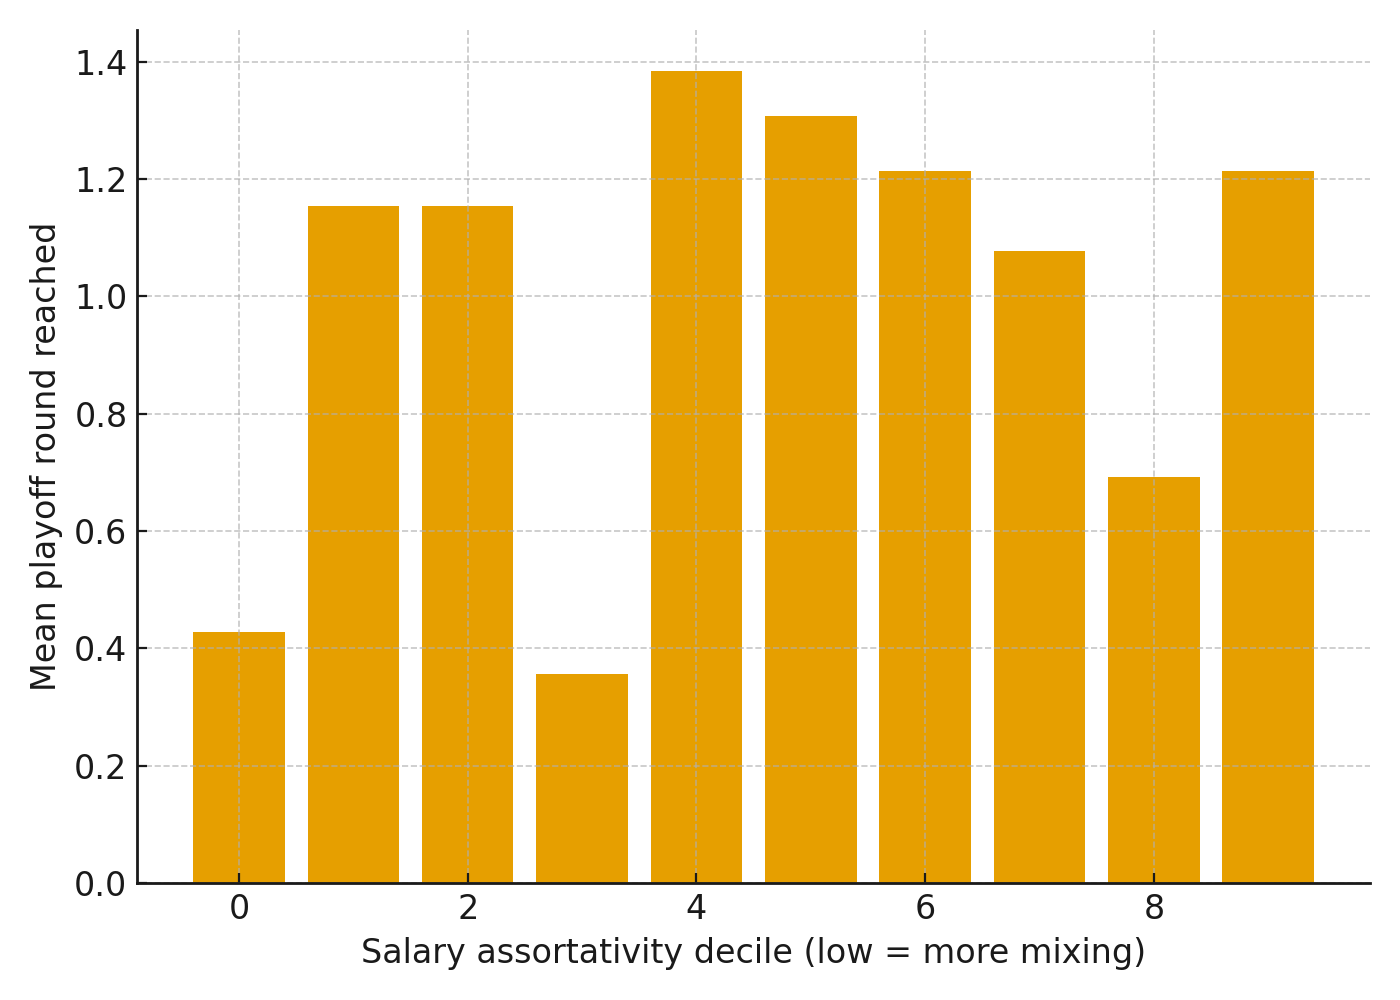
If you rank teams by how well they mix salaries, the ones near the top of that list are the ones still playing in June. That’s actionable scouting intel.
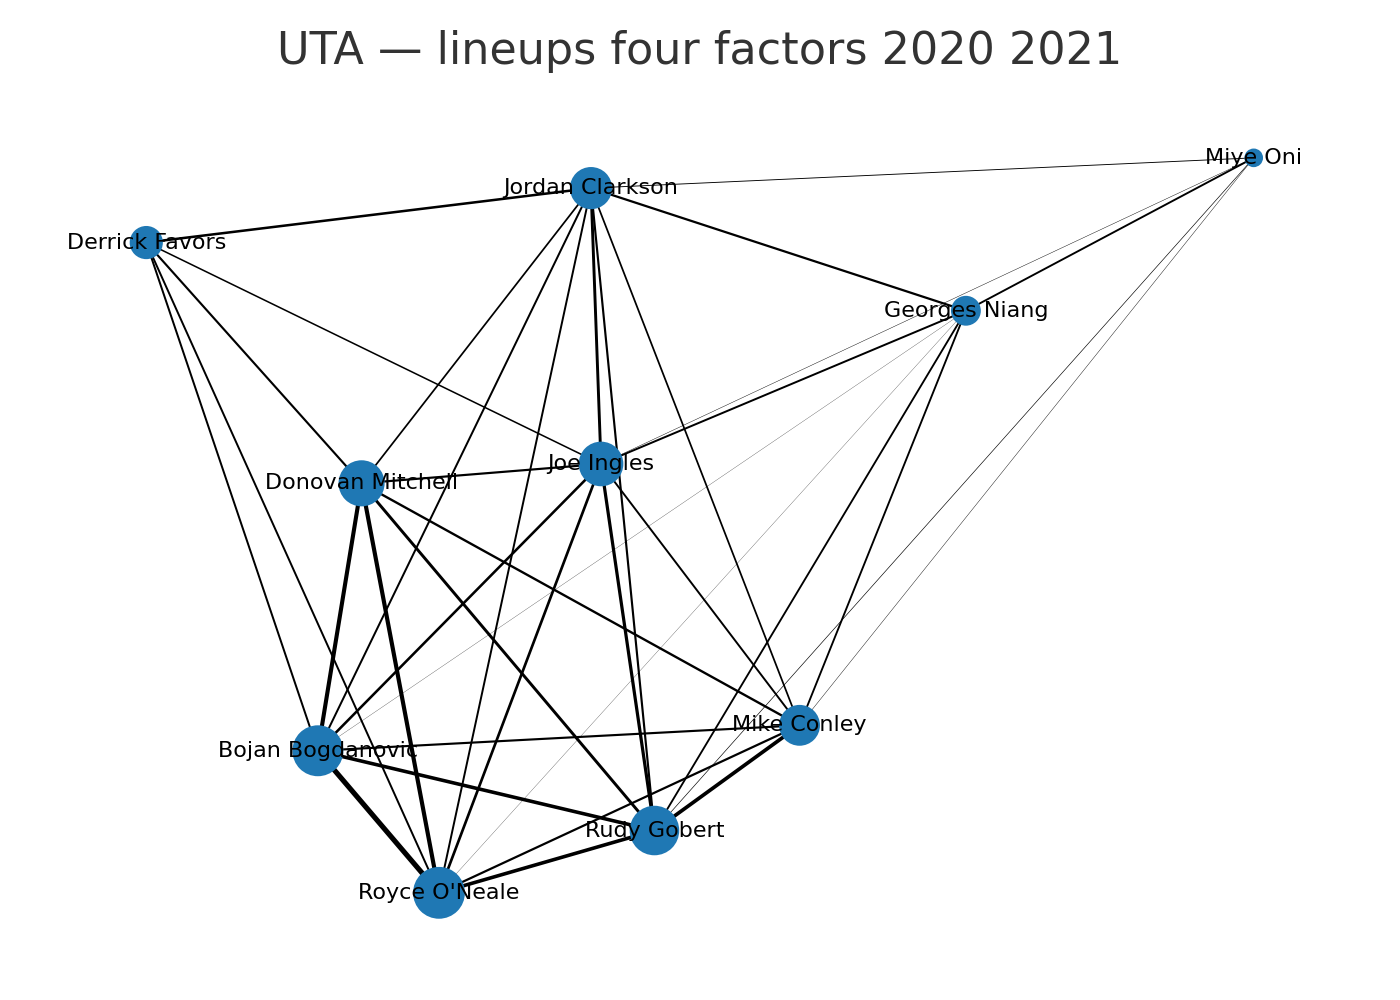
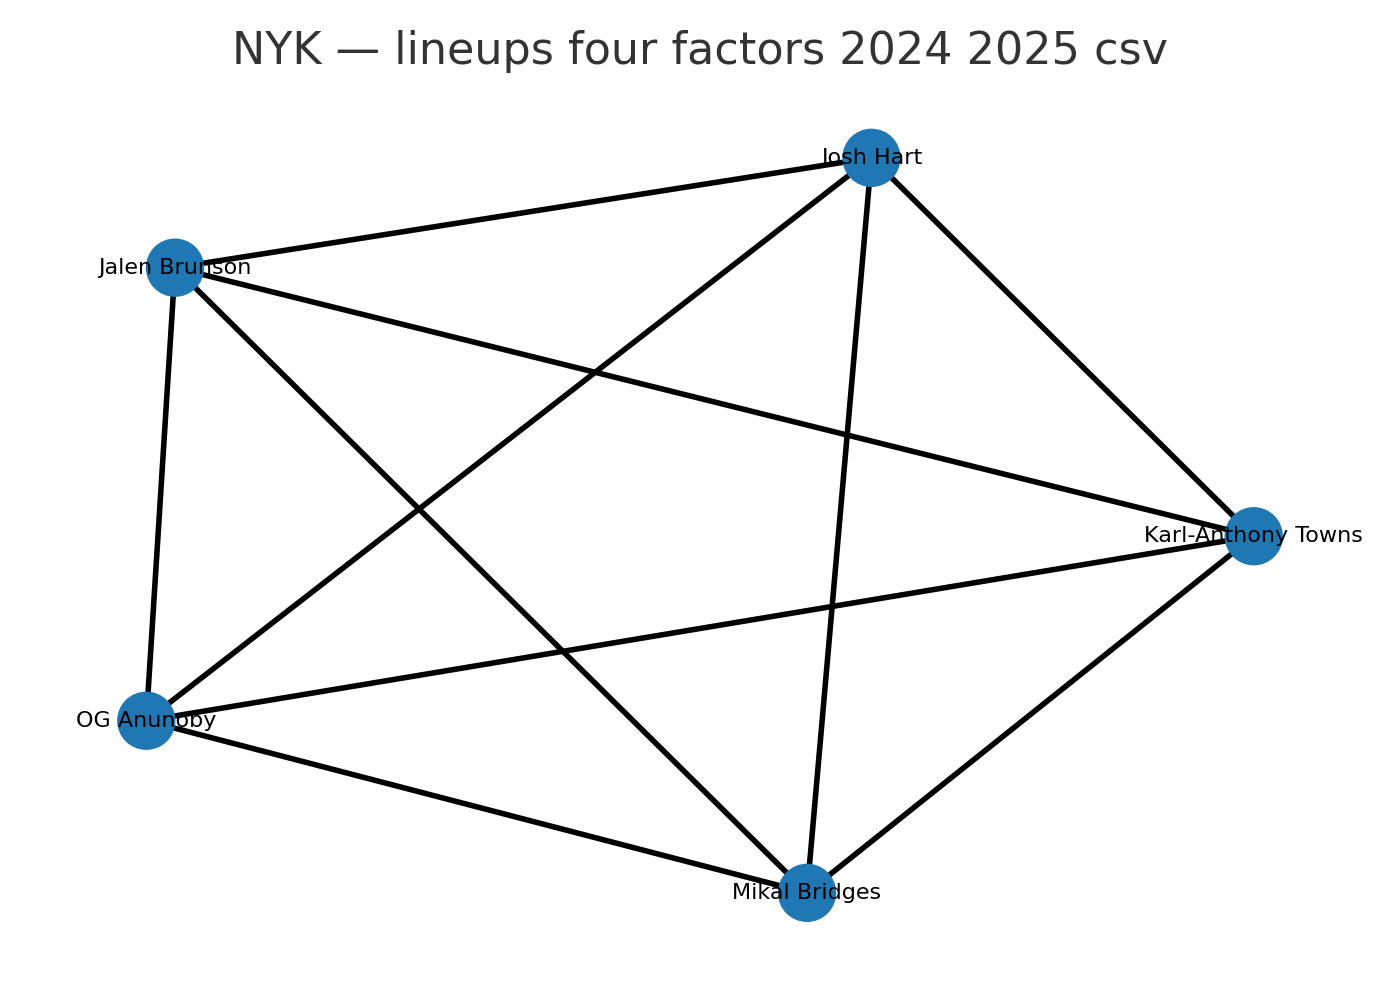
Case studies of network geometry
Two anonymized team-seasons with similar expected playoff round from the ordinal model but different topology: one star-centered with high edge concentration and one more distributed with balanced communities. The latter aligns with a higher resilience profile.
Side-by-side, the “star-and-spokes” roster looks pretty until the hub sits. The distributed version keeps multiple playmaking bridges alive, so no single injury breaks the machine.
Model diagnostics
Threats to validity
Salary data. Name resolution can miss two-way or ten-day players. We report match rates and rerun the analysis with strict and lenient filters.
Leverage. Edges currently reflect possession counts, not clutch weighting. A close/late variant is on the roadmap as an ablation.
Confounding. Minutes, role, and salary correlate tightly. We include non-roster (NR) strength as a control and publish ablations.
Measurement. Co-presence abstracts away play types, and community detection is coarse. Future work can add tracking data to enrich edge semantics.
Generalisation. Five seasons and 149 team-seasons limit scope. We favour regularisation and season-wise cross-validation to keep claims modest.
RRS scaling. When \(|\widehat{\mathrm{NR}}^{\text{intact}}|\) approaches zero, normalisation can exaggerate resilience. We winsorise in sensitivity checks to stabilise the metric.
Ethics and transparency
All data were obtained from public sources: Basketball-Reference and Cleaning the Glass. We comply with the providers' terms of use. We release code, seeds, and environment files so readers can reproduce results with publicly accessible exports.
Reproducibility statement
We provide data-processing scripts for lineup graphs and salary merges, pinned environment files, a Makefile to regenerate all tables and figures, and documented loaders for Basketball-Reference and Cleaning the Glass exports.
Conclusion
We link salary-weighted roster topology to lineup connectivity and show that connectivity adds information beyond team strength. Across five seasons, topology features, especially salary assortativity and edge concentration, improve ordinal playoff prediction over a strength-only control. A permutation falsification confirms that observed negative assortativity is not a byproduct of roster size or lineup coverage. Outcome analyses based on playoff rounds support the same pattern. For practice, front offices can stagger high salaries across lineups and reduce edge concentration. These steps can improve robustness without raising total payroll. Future work should incorporate leverage-weighted edges, expand seasons and leagues, and add richer controls such as injuries and rest.
Bottom line for hoop heads: stagger your stars, keep trusted combos across the rotation, and treat payroll like a web, not a totem pole. That’s what the math is screaming.
References
- D. J. Berri and M. B. Schmidt, Stumbling on Wins. FT Press, 2010.
- R. Fort and J. Quirk, “Cross-subsidization, incentives, and outcomes in professional team sports leagues,” Journal of Economic Literature, vol. 33, no. 3, pp. 1265–1299, 1995.
- J. H. Fewell, D. Armbruster, J. Ingraham, A. Petersen, and J. S. Waters, “Basketball teams as strategic networks,” PLOS ONE, vol. 7, no. 11, p. e47445, 2012.
- R. Albert, H. Jeong, and A.-L. Barabási, “Error and attack tolerance of complex networks,” Nature, vol. 406, no. 6794, pp. 378–382, 2000.
- Basketball-Reference.com, “NBA statistics and history,” basketball-reference.com, accessed 2025.
- Cleaning the Glass, “NBA lineup and four-factor statistics,” cleaningtheglass.com, accessed 2025.