Holes in the Defense: A Geometric Currency for Basketball Advantage
This is the web version of a longer write-up. Same model, same numbers, less throat-clearing. If you want the PDF with every table, it's in the repo.
The thing coaches see that the box score can't
Watch a pick-and-roll from behind the play and what you see is not a pass or a shot. You see a defender a step late, a big who stepped up to show and left the paint behind him, and for about a second the entire strong side of the floor belonging to the offense. Then the help arrives, the corner defender sinks, and the space closes. Sometimes the ball gets there first. Usually it doesn't.
That second is what coaches mean by advantage. Every offensive action is an attempt to create it, and every defensive rotation is an attempt to repair it. The play-by-play records only the endpoint. So I wanted to know: can you measure the space itself, as a number, every fifth of a second, and does that number behave the way basketball says it should?
SkillCorner published ten Liga ACB games of broadcast tracking: every player and the ball at 25 Hz, each position carrying its own expected error, plus a marked play-by-play with picks, off-ball screens, handoffs, drives, isolations, closeouts and who was guarding whom. That is enough to build the field and, more importantly, enough to test it.
What an "empty hole" is
Here is the whole model in three steps.
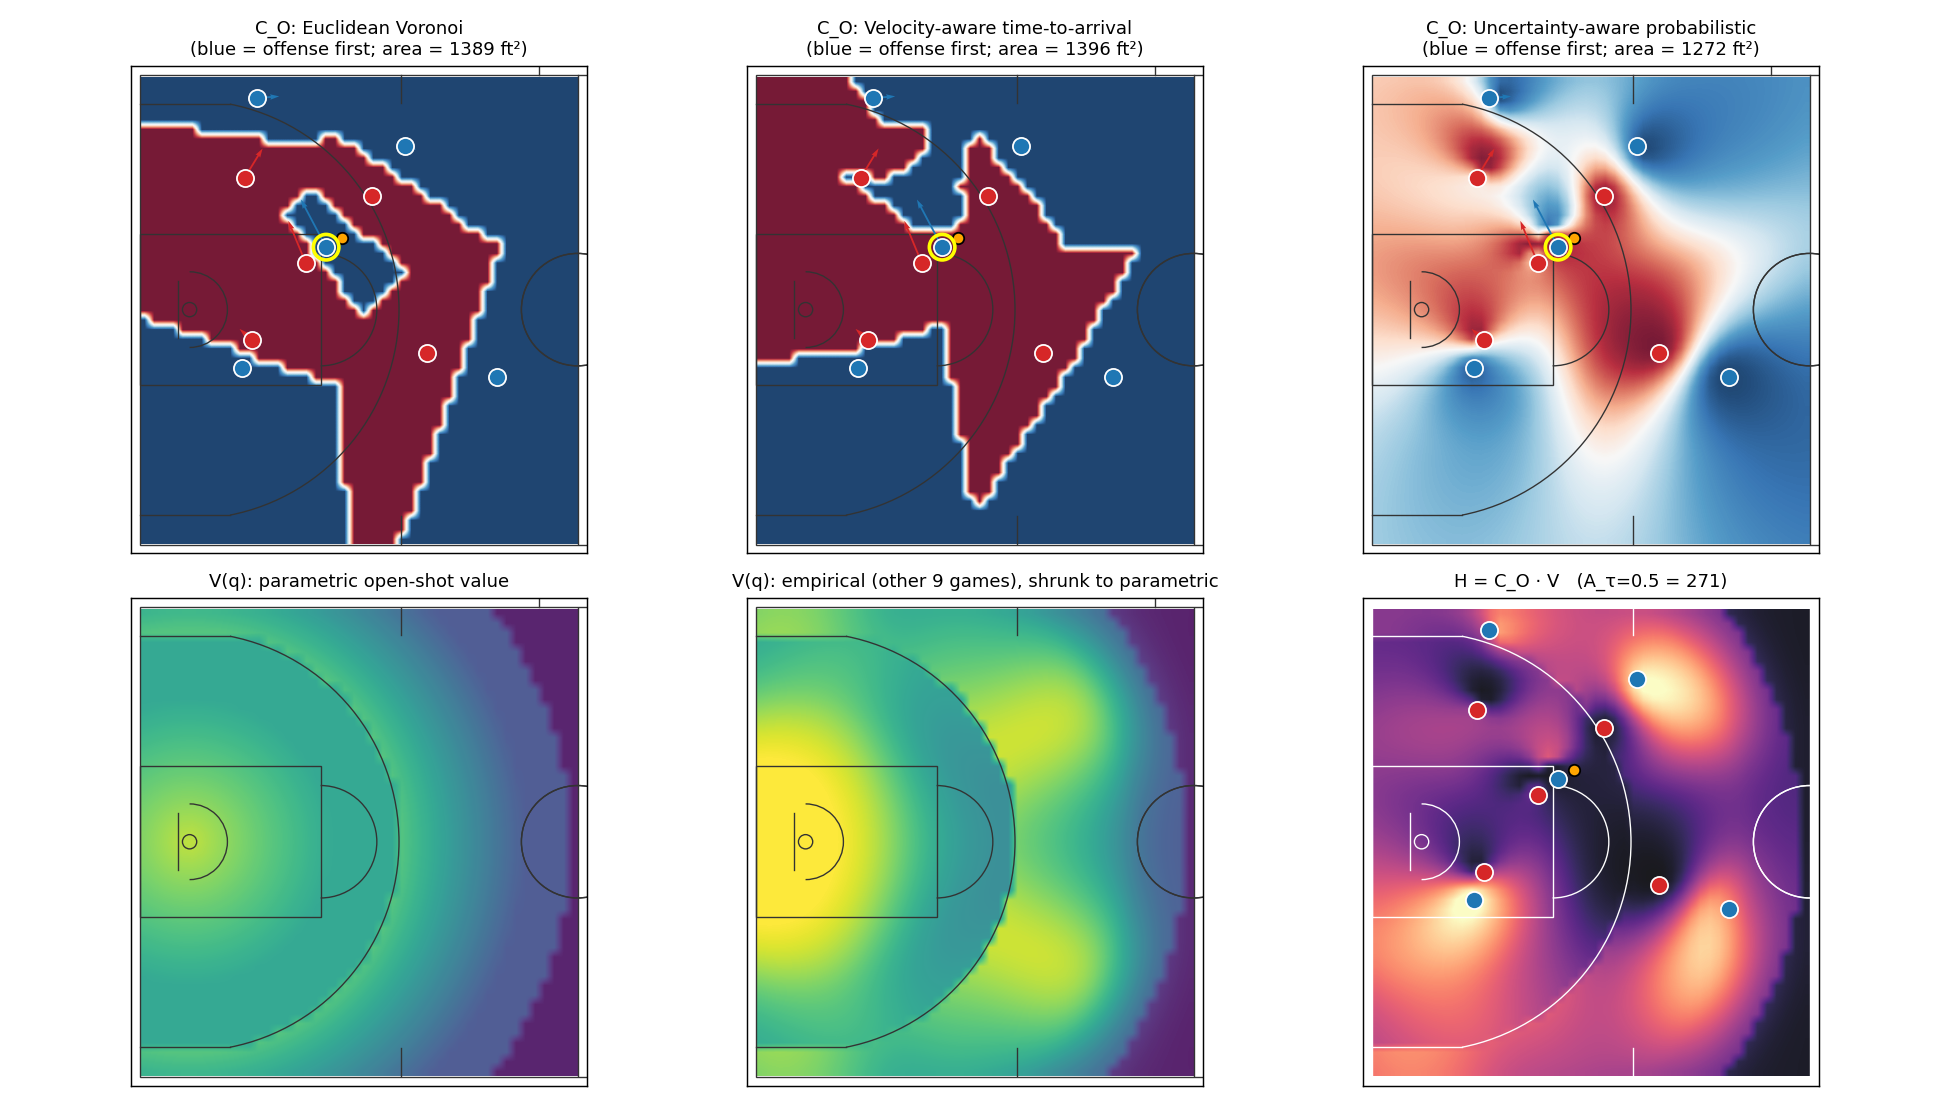
1. Who gets there first. For every player and every square foot of the offensive half court, estimate the time to arrive: keep going at your current velocity for a 0.2 s reaction time, then accelerate toward the spot at up to 20 ft/s² and cap at 20 ft/s (both fitted from the tracking; a player running the wrong way has to stop first). Treat that time as uncertain, with a floor of 0.15 s for indecision, an extra term from SkillCorner's stated position error (inflated for extrapolated players), and a term that grows with distance. Then compute the probability that the first offensive player arrives before the first defender. With Gaussian arrival times that has a closed form (Clark's recursion for the minimum of Gaussians), which I checked against Monte Carlo on real frames: mean absolute error 0.016 in probability.
2. What the spot is worth. Multiply by the expected points of an open shot from there: a smooth map fitted on open and lightly-contested shots from the other nine games, shrunk toward a simple parametric shape where data are thin. Rim about 1.35, mid-range 0.85, corner three a bit over 1.
3. Add it up. The exploitable-space measure \(A\) is the integral of that field over the cells worth at least half a point:
\[ H(q,t) = \underbrace{P\big(\min_{i\in O} T_i(q,t) < \min_{j\in D} T_j(q,t)\big)}_{\text{offense reaches } q \text{ first}} \times \underbrace{V(q)}_{\text{open-shot value}}, \qquad A(t) = \int \max\big(0,\,H(q,t)-0.5\big)\,dq. \]
Units are ft²·points. A typical half-court frame sits around 250-300.
Then one split that turned out to matter. Every cell that counts toward \(A\) is either within 5 ft of an offensive player or it isn't. The first kind is an open player: a shooter standing in the corner with nobody near him. The second kind is an empty hole: valuable space nobody is standing in, but which an attacker who cut or drove there would reach before any defender. An empty hole is the geometric footprint of a defender being out of position. An open player is a player being open. They are different things, and the actions that create them are different.
Two simpler models ride along as baselines everywhere: plain Euclidean Voronoi (nearest body wins, no velocity, no uncertainty) and the same kinematic arrival times without the uncertainty (deterministic winner). The whole point of the exercise was to find out whether the probabilistic version earns its complexity.
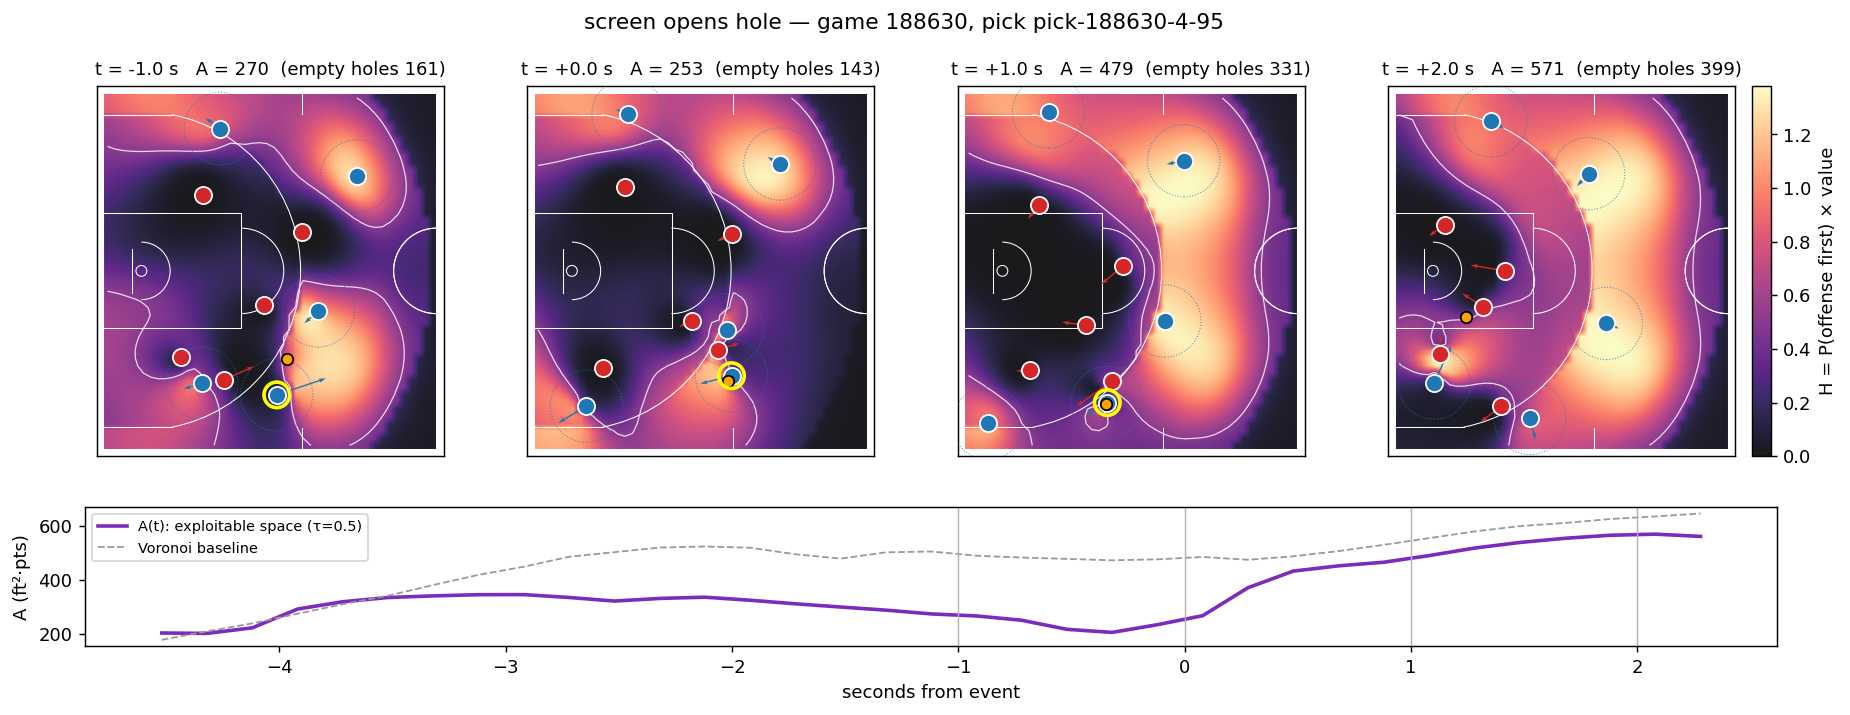
You can scrub through eight possessions yourself, with the empty-holes-only view, in the interactive replay.
Does it move the way basketball says?
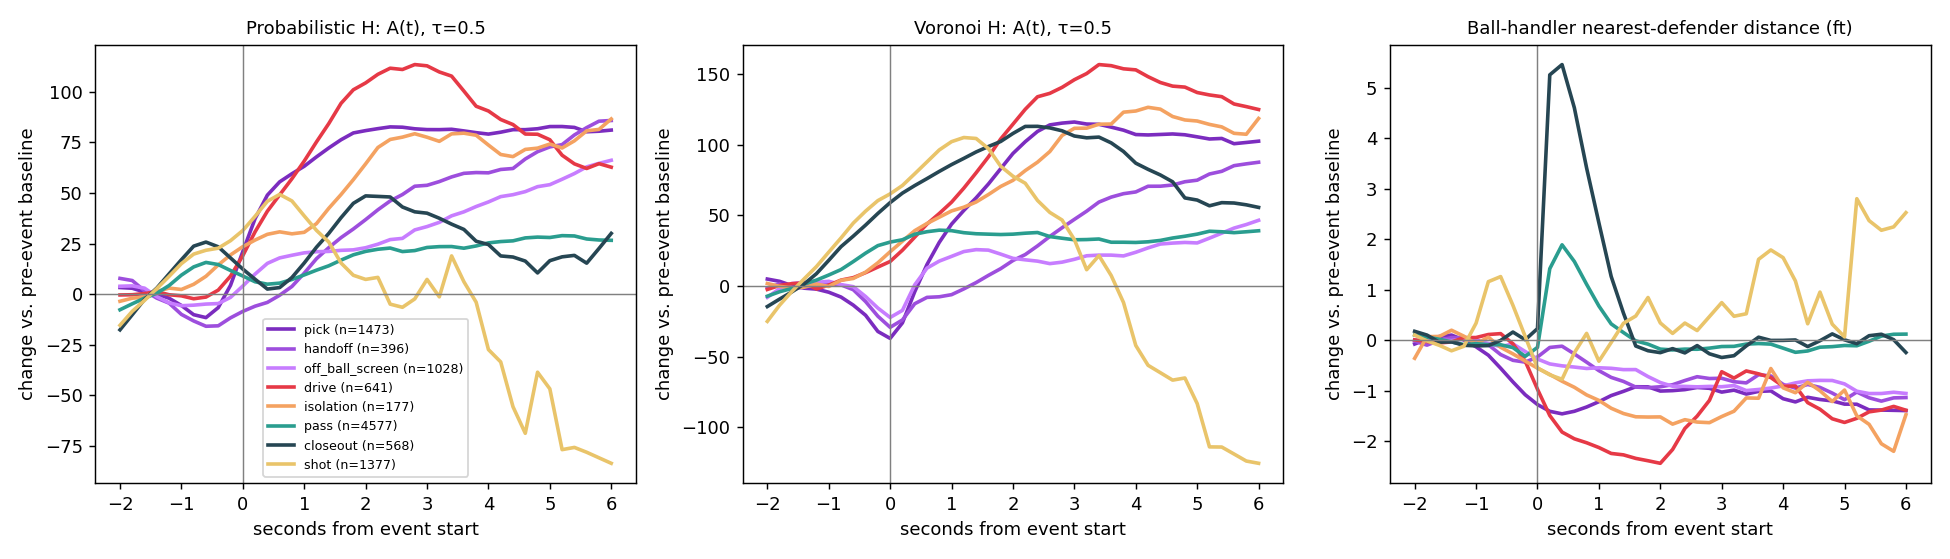
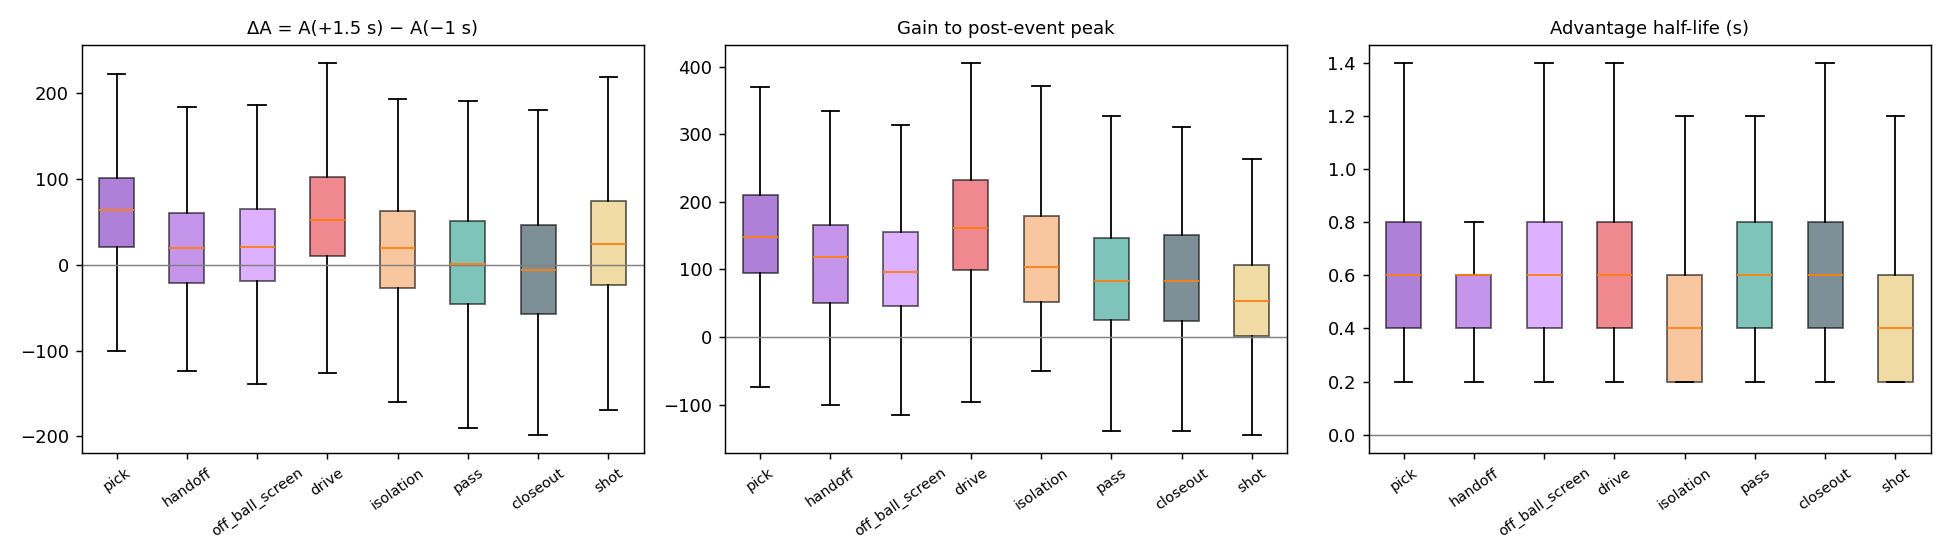
For every marked action in the ten games I took the mean of \(A\) over the 1.5 s after the action minus the mean over the second before it, and did the same for 1,350 random no-action moments (at least a second from any marked event). \(A\) drifts upward by about 11 units on its own as the shot clock runs down, so the number to read is the excess over that null.
| Action | n | ΔA over null | P(ΔA > 0) | empty-hole part | open-player part |
|---|---|---|---|---|---|
| Pick (on-ball screen) | 1,196 | +49.8 | 0.84 | +43.5 | +6.2 |
| Drive | 512 | +44.2 | 0.80 | +40.0 | +4.2 |
| Off-ball screen | 838 | +11.7 | 0.63 | +12.4 | −0.7 |
| Isolation | 146 | +9.2 | 0.56 | +6.0 | +3.2 |
| Handoff | 325 | +7.9 | 0.61 | +9.1 | −1.2 |
| Pass | 2,676 | −8.2 | 0.50 | −7.4 | −0.7 |
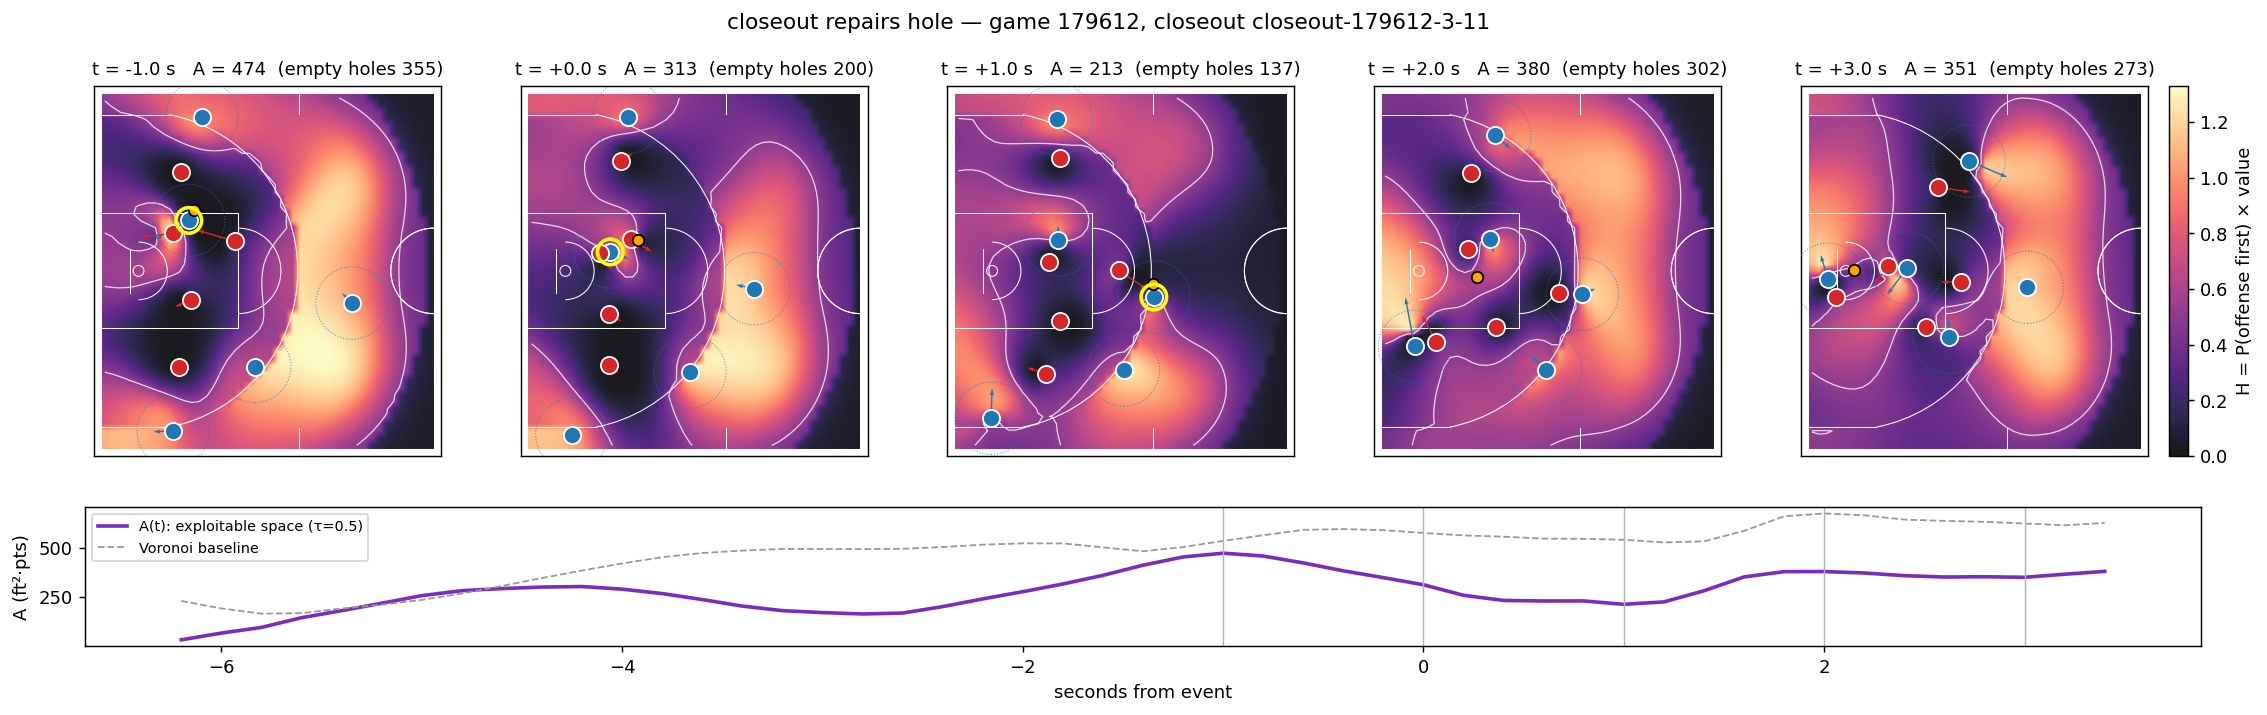
| Closeout (defensive) | 453 | −15.6 | 0.46 | −11.8 | −3.8 |
| No action (null) | 1,352 | 0 | 0.55 | — | — |
Picks and drives are significant at \(p<10^{-30}\); off-ball screens, closeouts and passes at \(p<10^{-3}\); handoffs and isolations are not (Mann-Whitney against the null).
Three things I did not put in by hand. The ordering is the one a coach would give: screens and drives create advantage, off-ball actions create less, and the one defensive action in the data, the closeout, is the only thing that destroys it. Almost everything a pick or a drive creates shows up as empty holes rather than as open players; the measure is seeing the defense get pulled out of shape, not just a man getting free. And a pass, on average, loses a little: the ball is in the air and the defense uses the flight time. Passes cash advantage in; they don't make it.
The baselines get the closeout backwards
This is the result I care most about. On Euclidean Voronoi the closeout scores +23 over the null. A defender sprinting at the ball handler gives up the Voronoi cells behind him, so the area measure reads a defensive recovery as an offensive gain. Voronoi also scores handoffs at −20. The ball handler's nearest-defender distance moves less than 4 ft for any action. The offensive convex hull shrinks on drives and picks. Only the two models that know about motion recover the basketball ordering, and only the probabilistic one keeps the sign of every action right.
| Measure (excess over null) | Pick | Drive | Off-ball | Handoff | Closeout | Pass |
|---|---|---|---|---|---|---|
| Probabilistic \(A\) | +49.8 | +44.2 | +11.7 | +7.9 | −15.6 | −8.2 |
| Kinematic \(A\) | +70.8 | +60.3 | +4.1 | +5.3 | −14.9 | −14.8 |
| Voronoi \(A\) | +26.9 | +24.8 | +0.6 | −20.1 | +23.2 | +1.4 |
| Handler nearest-defender distance (ft) | +0.3 | −1.0 | +0.5 | +0.7 | +4.0 | +1.9 |
| Offensive convex hull (ft²) | −12 | −63 | +36 | +52 | +4 | +27 |
How fast the defense repairs it
After the post-action peak, \(A\) falls halfway back to its pre-action level in a median of 0.6 s for picks, drives, handoffs and off-ball screens. The defense fixes most holes fast. What differs is how often it can't: 68% of drive-created advantage is still there 3 s later, against 54% for picks, 54% for the null and 47% for closeouts. Drives are the action whose advantage most often outlives the reaction, which is why they end in shots.
One currency, every coverage
Because everything is scored on the same field, the SkillCorner coverage labels can be compared directly, and they line up with the coaching vocabulary without anything being tuned to make them.
| Context | n | ΔA over null |
|---|---|---|
| Pick, handler defended over the screen | 775 | +58.6 |
| Pick, defense switches | 168 | +35.7 |
| Pick, handler defended under | 219 | +29.4 |
| Pick, screener's man shows | 485 | +58.0 |
| Pick, screener's man drops | 504 | +46.6 |
| Pick at the step-up / middle / wing | 154 / 734 / 288 | +64.6 / +55.5 / +27.3 |
| Off-ball screen, cutter trailed | 441 | +18.6 |
| Off-ball screen, cutter whipped (defender beats him through) | 319 | +0.7 |
| Off-ball screen, screener's man shows / drops | 47 / 594 | +49.9 / +9.2 |
| Drive created by a pick / by an isolation | 260 / 62 | +49.8 / +20.3 |
| Pass under 12 ft / 20-30 ft / over 30 ft (skip) | 642 / 650 / 133 | +2.4 / −19.2 / −21.6 |
| Closeout followed by a shot / by a pass | 215 / 83 | −12.2 / −22.8 |
Switching or going under costs the offense about 25 units relative to a defender who fights over. A show leaves the paint and concedes more than a drop. A step-up screen in the middle of the floor is the most productive on-ball action in the data; a wing screen creates less than half as much. A whipped off-ball screen creates nothing.
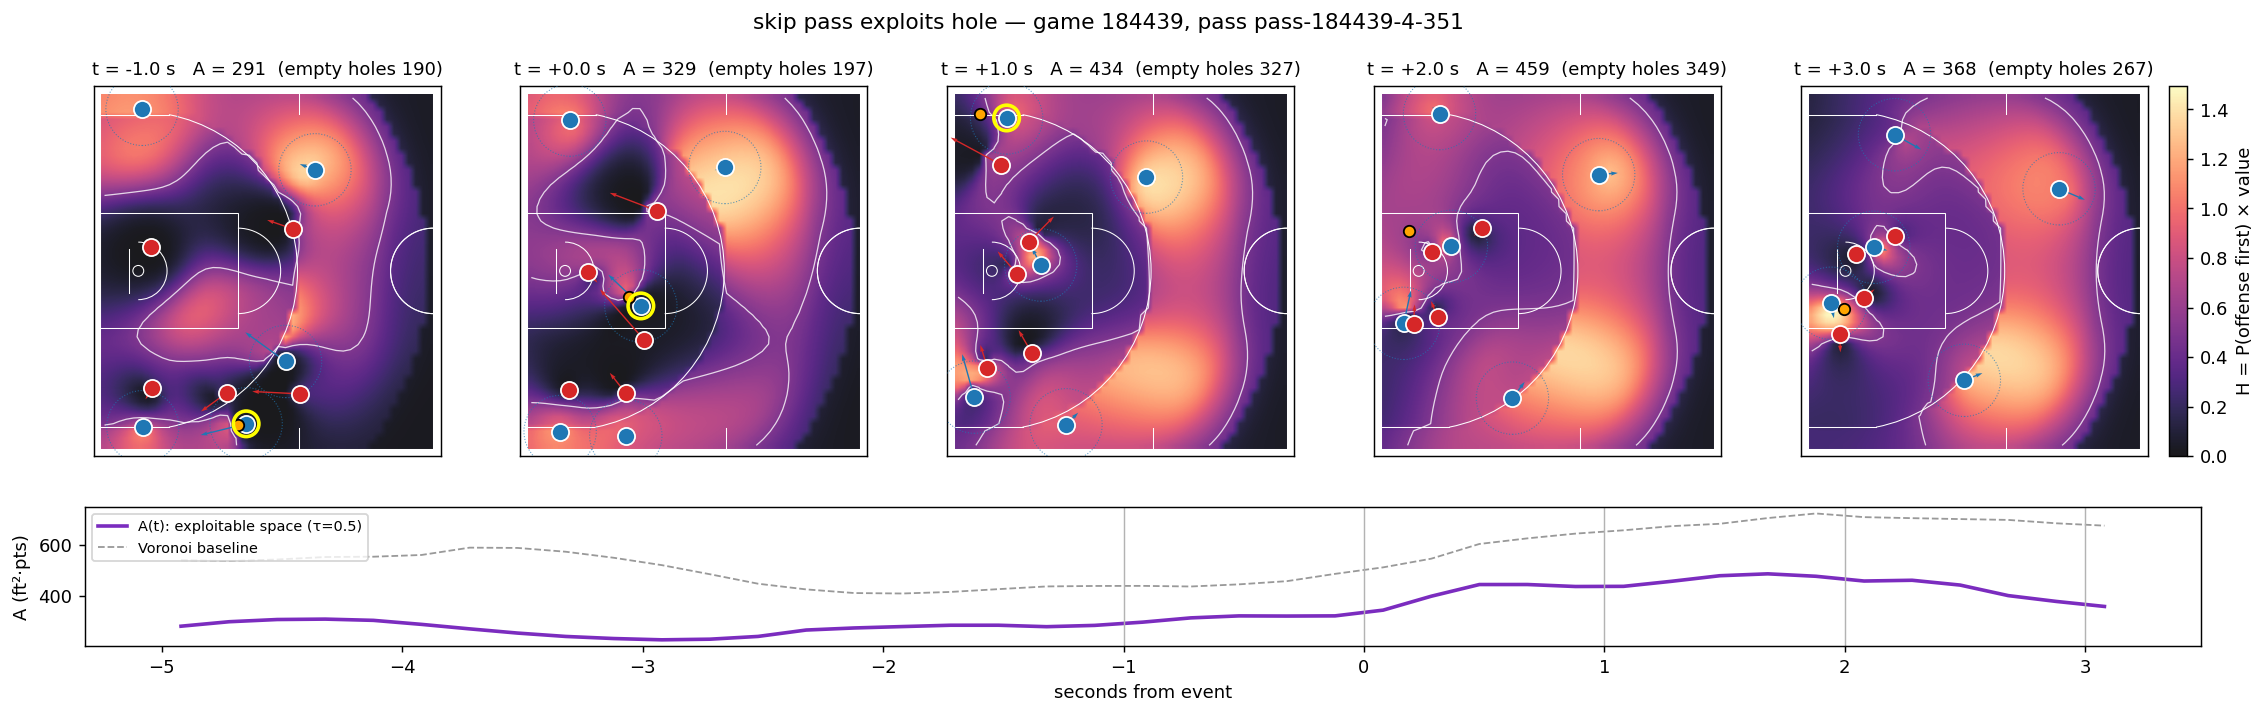
And then the skip pass, which coaches love precisely because it exploits a hole, comes out negative. That is an honest limitation of a field that values space rather than ball position: the skip pass doesn't create a new hole, it moves the ball into one that already exists, and the flight time lets the defense move. Here is what that looks like.
Does the number predict anything?
Pretty pictures are cheap. The real test is whether \(A\) knows something a model with the ball location, the defender distances, the convex hulls and the Voronoi areas does not. So: from every half-court frame, predict what happens in the next 3 s of the same possession, training on nine games and testing on the tenth, ten times over. No random splitting of neighbouring frames, which would leak like a sieve.
| Next 3 s (logistic, AUC) | rate | ball only | baseline (16 spacing / defender features) | + Voronoi | + kinematic | + probabilistic |
|---|---|---|---|---|---|---|
| Any shot | 0.24 | 0.660 | 0.722 | 0.731 | 0.741 | 0.766 |
| Open / lightly contested shot | 0.06 | 0.606 | 0.699 | 0.712 | 0.723 | 0.740 |
| Shot at the rim | 0.08 | 0.724 | 0.775 | 0.776 | 0.785 | 0.797 |
| Assist opportunity | 0.11 | 0.539 | 0.606 | 0.615 | 0.617 | 0.651 |
| Paint touch | 0.14 | 0.523 | 0.578 | 0.583 | 0.585 | 0.617 |
| Blow-by | 0.02 | 0.599 | 0.619 | 0.607 | 0.628 | 0.615 |
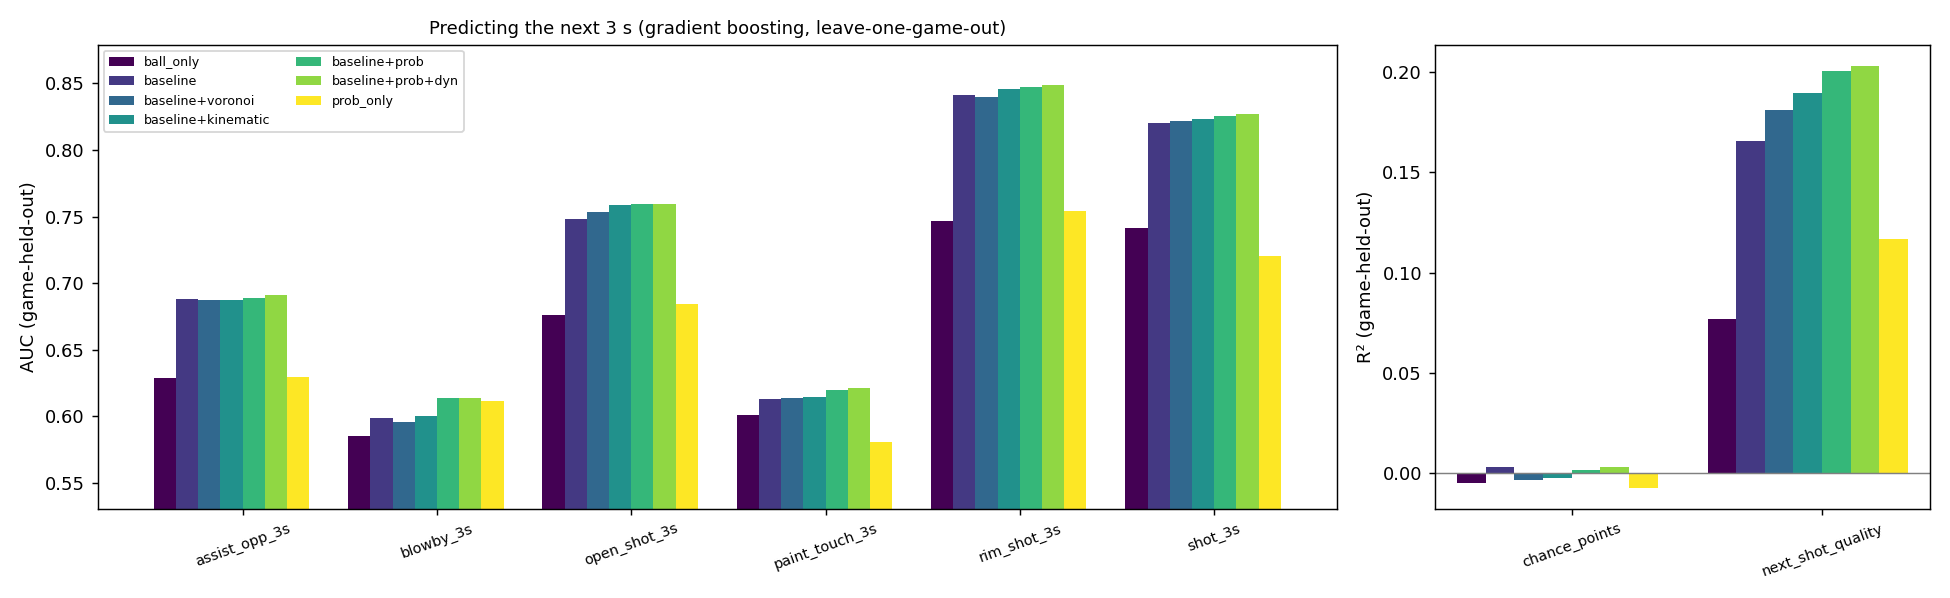
With a linear model the gain is monotone in model sophistication for every target but blow-bys: Voronoi adds a little, kinematic more, probabilistic most, +0.04 AUC on shots and open shots and +0.045 on assist opportunities and paint touches. The field's own summaries, with no ball or defender information at all, predict a shot in the next 3 s at 0.69.
Gradient boosting narrows the gap, as it should; with enough trees it can rebuild spatial structure from raw coordinates. Even so the field survives on the two targets that are most about space: blow-bys (0.599 to 0.614 AUC) and the SkillCorner quality grade of the next shot (\(R^2\) 0.166 to 0.200, Voronoi 0.181), and nothing gets worse. Adding the one-second change in \(A\) on top of its level adds nothing; the level is what carries the information.
Two negatives belong in the record. Nothing predicts the points the possession ends with from a single frame (\(R^2 < 0.005\) for every feature set); the next three seconds are geometric, the end of the possession is not. And within an action kind, the advantage an action creates does not predict the points scored on that possession either. Creating advantage and using it are different skills, and this field only measures the first.
Possessions, one at a time
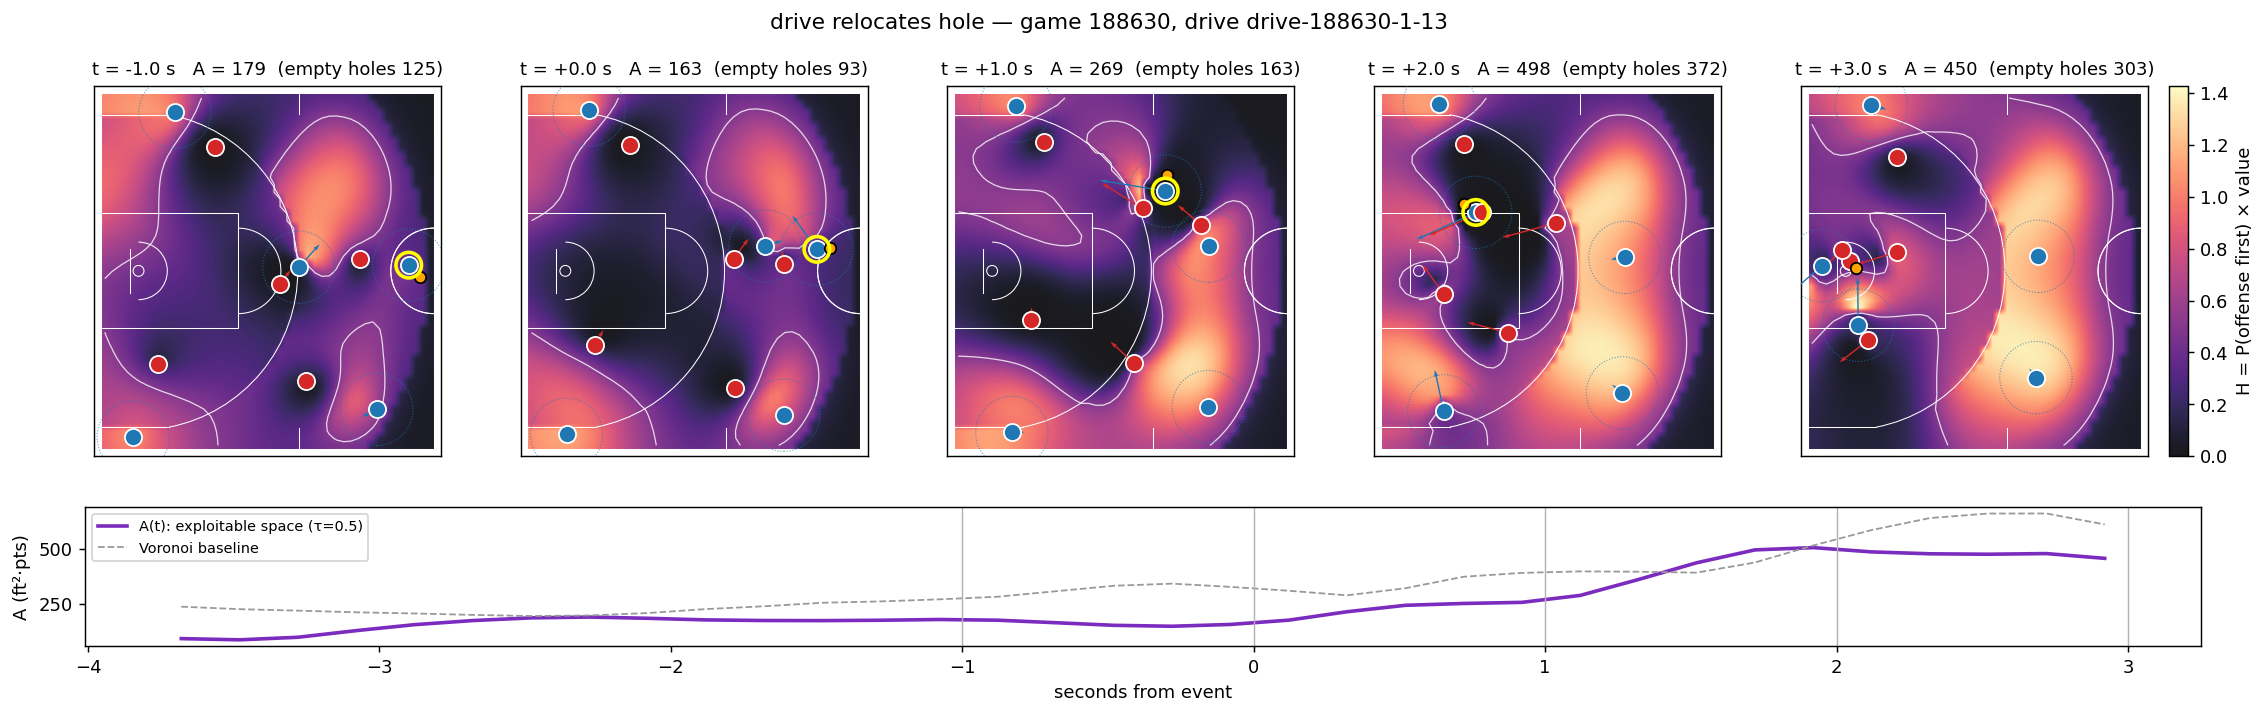
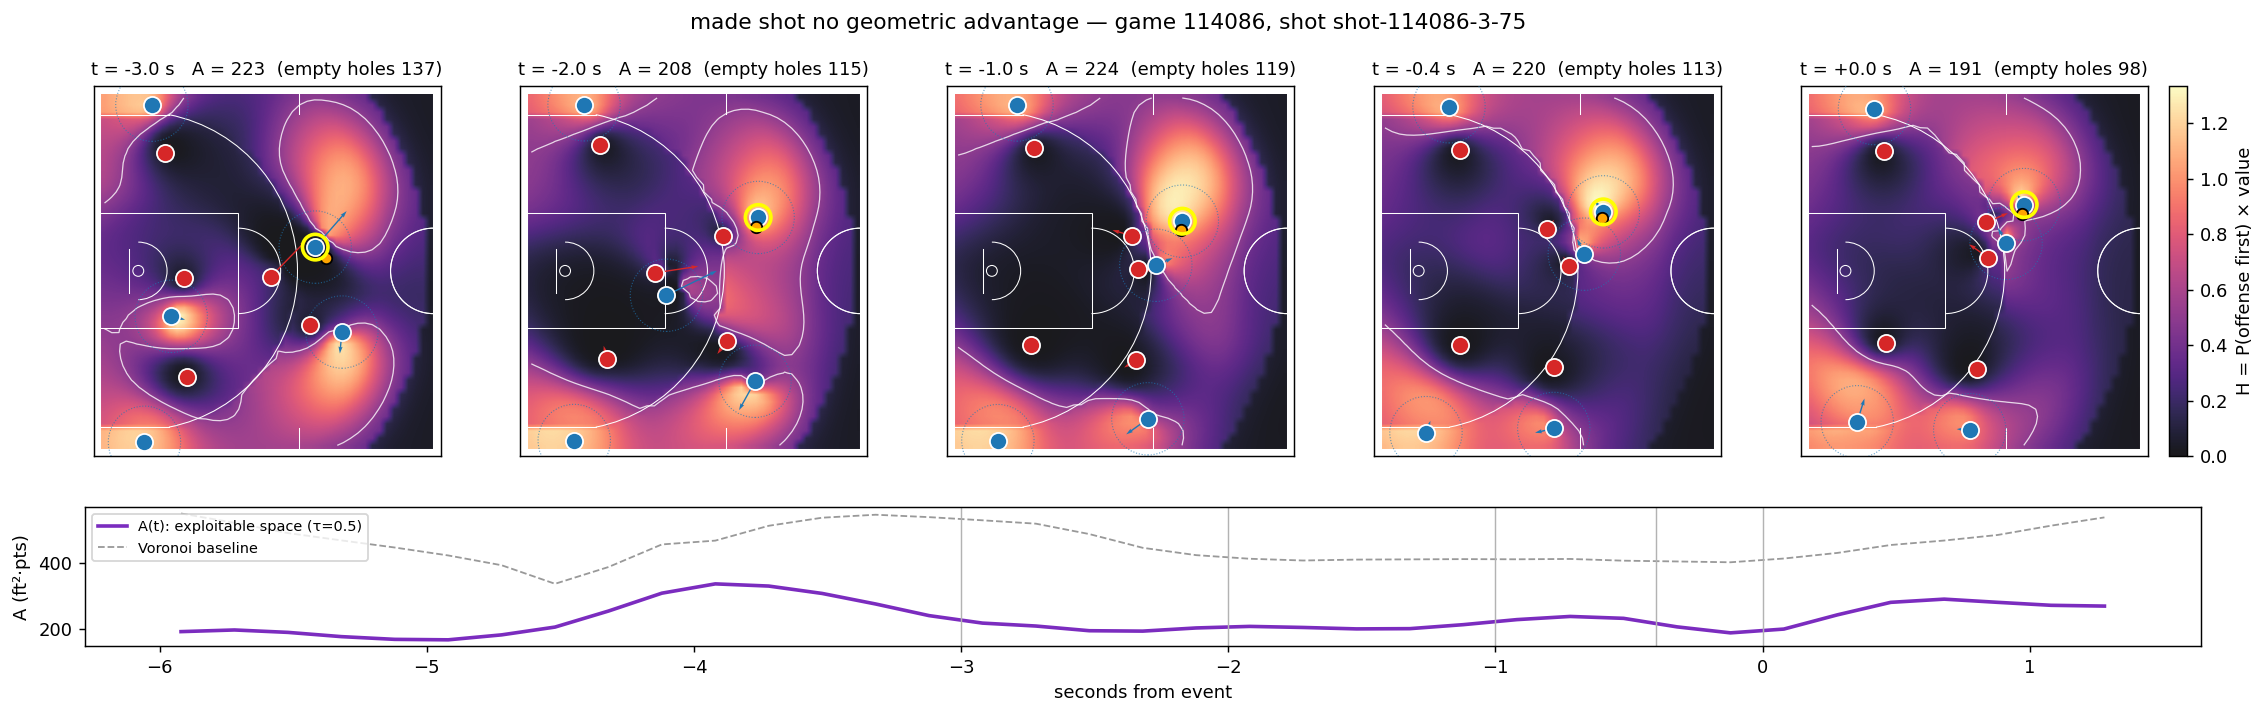
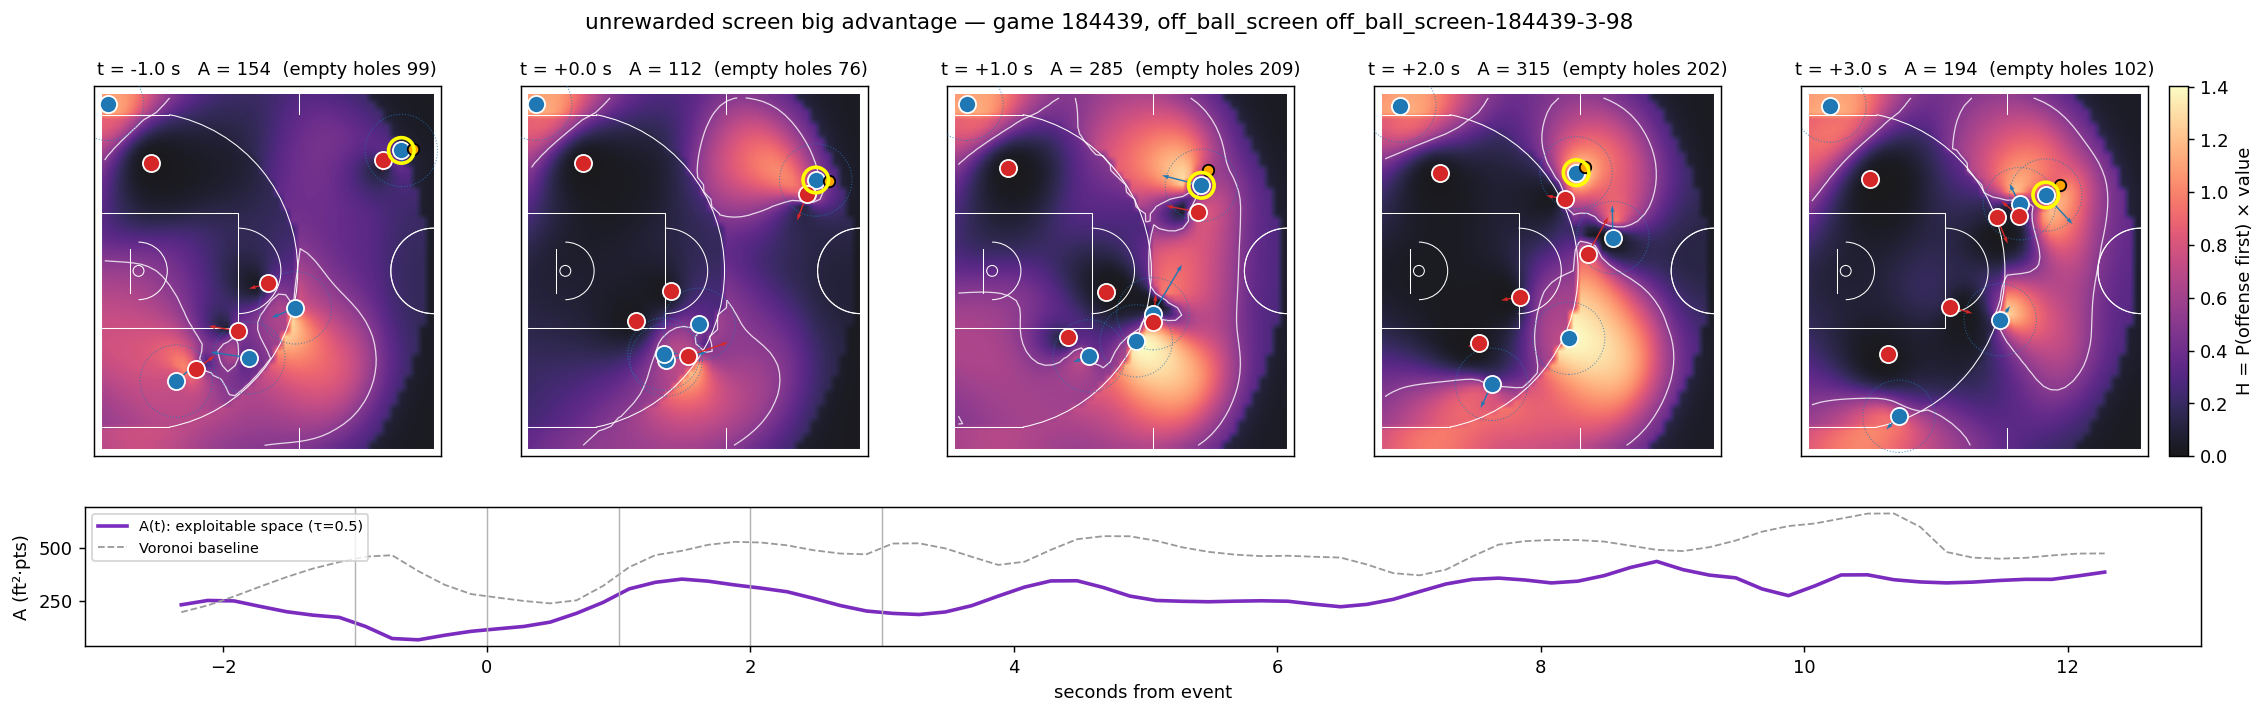
The examples were chosen by a rule, not by me: clean tracking (no more than one extrapolated player), gain between the 85th and 97th percentile for the action kind, distinct possessions. Dotted circles are the 5 ft occupancy radius; the white line is the \(H = 0.5\) contour. Bright space outside every dotted circle is an empty hole.
Holes as objects
If you take every connected region of \(H > 0.5\) that is more than 5 ft from every attacker and link them frame to frame, you get 15,795 holes across the ten games. Most die fast: median lifetime 0.6 s, mean 2.0 s. Only 8% are ever entered by the ball. But use is concentrated where you'd hope: holes that survive 2.4 s get used 30% of the time, holes in the top mass tercile 24%, holes that live under 1.2 s essentially never. Holes born after an off-ball screen (mean 1.5 s) or a handoff (1.4 s) live longer than those born after a drive (0.7 s). Off-ball actions open space that is waiting; drives open space that is closing.
What it took to break it
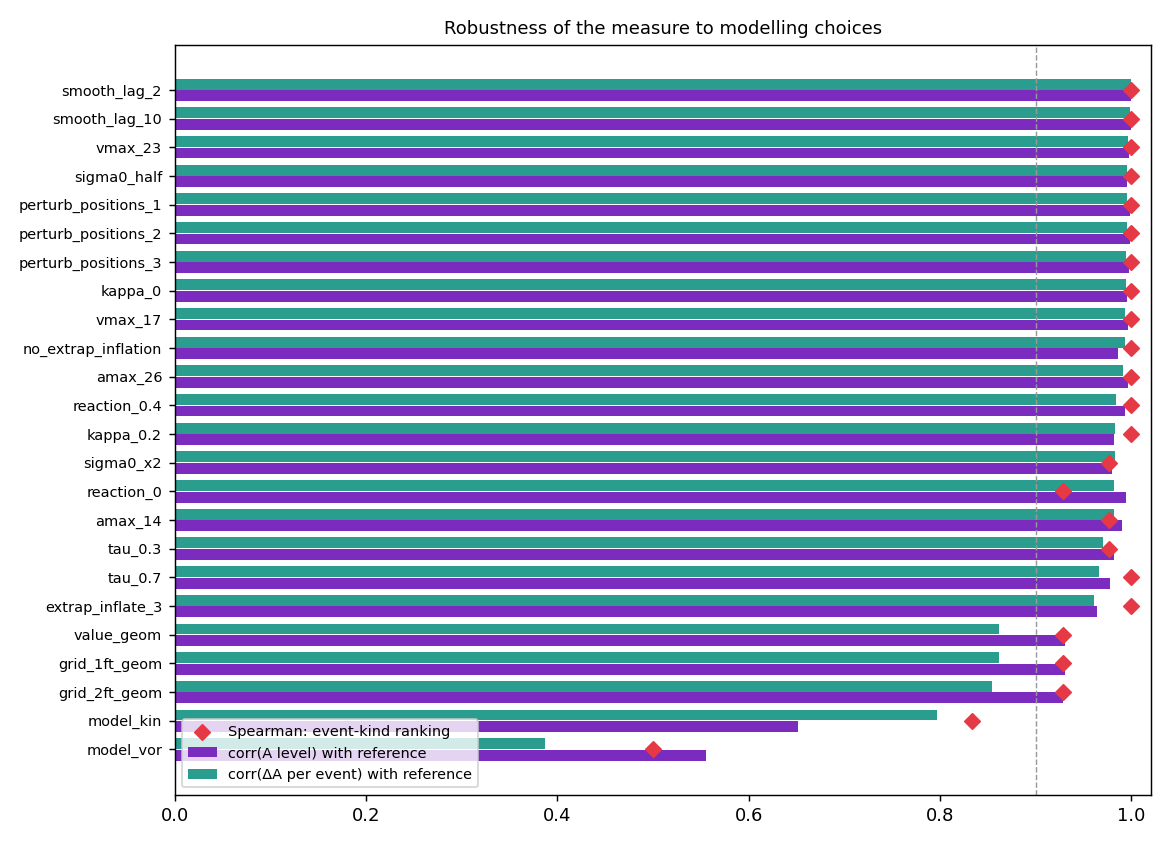
For 1,010 event windows I recomputed everything under 24 alternative configurations. Resampling every position from its own stated tracking error, and varying every constant in the movement model, the threshold and the grid, keeps per-event changes correlated above 0.96 with the reference and the action ranking at or near 1.0. The only choices that matter are the two that should: the value map (parametric vs. empirical, correlation 0.86) and the control model. Swap in kinematic and the correlation drops to 0.80; swap in Voronoi and it drops to 0.39 and the closeout flips sign.
What it does not do
- It values space, not the ball. The skip-pass problem. A ball-conditioned variant behaves the same way; a real fix needs a passing model, which ten games won't support.
- Creation is not conversion. Nothing here says who cashes in.
- Three seconds, not a possession. It is a description of state.
- Defensive intent is invisible. A defender sagging off a non-shooter on purpose registers as a hole. The empirical value map corrects for this on average, not by player.
- One movement model for everyone. No size, no fatigue, no dribbling slowdown. The conclusions don't depend on the constants, but a player-specific model would sharpen the field.
- Ten games. The per-game spread of the validation AUCs, 0.01-0.04, is the honest size of the error bars.
Conclusion
A basketball possession can be written as the creation, movement and closure of valuable holes in the defense, and that description can be computed from broadcast tracking with a model you can explain in a paragraph. The resulting number rises after the actions coaches call advantage-creating, almost entirely in space nobody is standing in yet; falls after the one defensive action in the data; separates coverages the way the coaching vocabulary does; predicts the next three seconds better than ball position, defender distance, convex hulls and Voronoi area; and survives being kicked. The Voronoi diagram it replaces gets the sign of a closeout wrong.
What it can't yet do is tell the offense which hole to use. That's the next thing: a passing model on top of the field, so a skip pass into an open corner gets credit for what it exploits instead of a debit for how long it took.
Reproduce it
Everything is in a fork of SkillCorner's release under analysis/: the library, the eight pipeline stages, the results tables, the paper, and the replay. Stage 1 takes about four minutes a game; the rest is minutes. Courts are drawn with mplbasketball; the FIBA half court it draws coincides with the tracking frame to within 0.05 ft, which is a nice thing to be able to check.